Prometheus+Grafana:一站式搞定监控告警全链路

Prometheus+Grafana:一站式搞定监控告警全链路

果酱带你啃java
发布于 2026-04-14 14:35:54
发布于 2026-04-14 14:35:54
一、为什么监控是分布式系统的"生命线"?
在微服务和分布式架构成为主流的今天,系统的复杂度呈指数级增长。线上服务突然卡顿、接口响应超时、服务器资源耗尽……这些问题如果不能及时发现和定位,小则影响用户体验,大则导致业务瘫痪。而传统的日志排查、人工巡检方式,早已跟不上分布式系统的节奏——你需要的是一套实时、可视化、可告警的监控体系,这正是Prometheus+Grafana组合的核心价值所在。
Prometheus(普罗米修斯)是由SoundCloud开源的时序数据库监控系统,天生为云原生环境设计;Grafana则是一款开源的可视化面板工具,能将Prometheus收集的时序数据转化为直观的图表。二者结合,就像给你的系统装上了"智能仪表盘"和"预警雷达",既能实时看到系统的运行状态,又能在问题发生前发出警报。
本文将从底层原理到实战落地,手把手教你搭建、配置、优化Prometheus+Grafana监控体系,所有示例均经过实际验证,可直接落地生产环境。
二、Prometheus核心原理:读懂监控的"底层逻辑"
2.1 核心概念拆解
在动手搭建前,先搞懂Prometheus的核心概念,避免只会"照抄配置"。
2.1.1 时序数据(Time Series)
Prometheus存储的核心是时序数据——带时间戳的键值对,格式为:指标名{标签名=标签值,...} 数值 时间戳。 例如:http_requests_total{method="GET",path="/api/user"} 12589 1710000000,表示在1710000000这个时间点,GET /api/user接口的请求总数是12589。
2.1.2 指标类型(Metric Type)
Prometheus定义了4种核心指标类型,这是监控的"基础积木":
- Counter(计数器):只增不减的数值,用于统计请求数、错误数、发送字节数等。例如
http_requests_total(总请求数)。 - Gauge(仪表盘):可增可减的数值,用于统计内存使用率、CPU负载、当前在线用户数等。例如
node_memory_usage_percent(内存使用率)。 - Histogram(直方图):统计数值的分布情况,用于分析请求延迟、响应时间等。例如
http_request_duration_seconds_bucket(请求延迟分桶统计)。 - Summary(摘要):与Histogram类似,但直接计算分位数(如P95、P99),无需手动计算。例如
http_request_duration_seconds_summary。
2.1.3 拉取式采集(Pull)
Prometheus采用"拉模式"采集数据:Prometheus Server主动向被监控目标(Exporter)发送HTTP请求,获取指标数据(默认端口9090)。这种模式的优势是:
- 无需在被监控端部署额外的推送代理,降低耦合;
- 可自主控制采集频率,避免被监控端突发大量数据压垮Server;
- 支持服务发现,动态识别新增的监控目标。
2.1.4 PromQL:监控的"查询语言"
PromQL是Prometheus的查询语言,能对时序数据进行多维度的筛选、聚合、计算,是实现监控告警的核心。例如:
- 筛选GET请求的总数:
http_requests_total{method="GET"} - 计算5分钟内请求数的增长率:
rate(http_requests_total[5m]) - 统计95%的请求延迟:
histogram_quantile(0.95, sum(rate(http_request_duration_seconds_bucket[5m])) by (le))
2.2 Prometheus架构解析
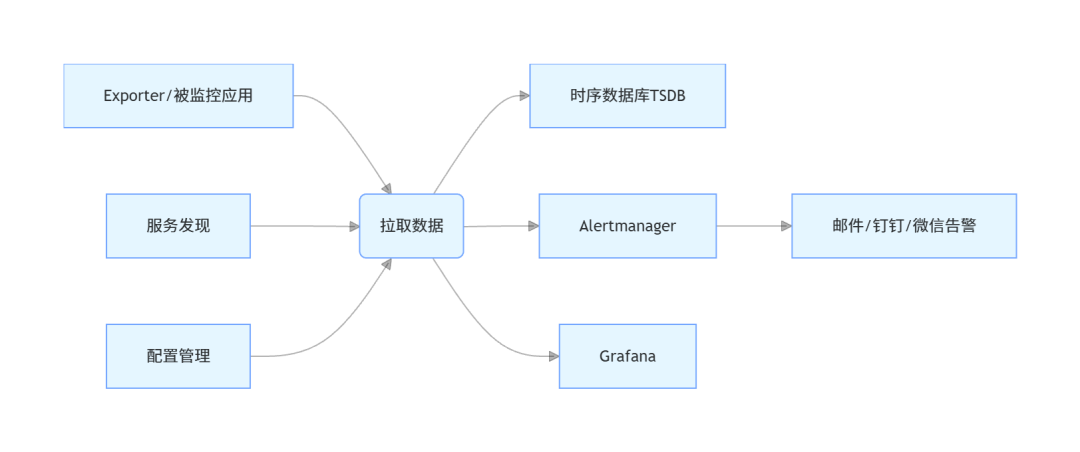
Prometheus的核心架构包含以下组件:
- Prometheus Server:核心组件,负责数据采集、存储、查询、告警规则评估;
- Exporter:数据采集代理,将不同类型的系统/应用指标转化为Prometheus可识别的格式(如Node Exporter采集服务器指标、MySQL Exporter采集数据库指标);
- Alertmanager:告警管理组件,负责接收Prometheus的告警信息,进行去重、分组、路由,最终发送到指定渠道;
- Grafana:可视化组件,通过PromQL查询Prometheus数据,生成仪表盘;
- 服务发现:动态发现监控目标(如K8s集群、Consul服务),无需手动配置每个目标;
- TSDB:Prometheus内置的时序数据库,高效存储时序数据。
三、实战:从零搭建Prometheus+Grafana监控体系
3.1 环境准备
本文以Linux(CentOS 7/8)为例,所有操作均为root用户执行,确保网络通畅,关闭防火墙或开放对应端口:
- Prometheus Server:9090
- Grafana:3000
- Node Exporter:9100
3.1.1 安装依赖
yum install -y wget tar vim
3.2 安装Prometheus Server
3.2.1 下载并解压
# 下载最新稳定版(可替换为最新版本号)
wget https://github.com/prometheus/prometheus/releases/download/v2.53.1/prometheus-2.53.1.linux-amd64.tar.gz
# 解压
tar -zxvf prometheus-2.53.1.linux-amd64.tar.gz
# 移动到/usr/local目录
mv prometheus-2.53.1.linux-amd64 /usr/local/prometheus
# 创建数据目录(TSDB存储位置)
mkdir -p /data/prometheus
3.2.2 配置Prometheus
编辑/usr/local/prometheus/prometheus.yml,这是Prometheus的核心配置文件:
global:
  scrape_interval:15s# 全局采集频率,默认15秒
evaluation_interval:15s# 告警规则评估频率,默认15秒

alerting:
alertmanagers:
    -static_configs:
        -targets:
          # 后续会配置Alertmanager,此处先留空
          # - localhost:9093

rule_files:
# 告警规则文件路径,后续配置
# - "alert_rules.yml"

scrape_configs:
# 监控Prometheus自身
-job_name:"prometheus"
    static_configs:
      -targets:["localhost:9090"]
# 监控Node Exporter(后续安装)
-job_name:"node_exporter"
    static_configs:
      -targets:["localhost:9100"]
配置文件核心说明:
global:全局配置,定义采集和规则评估频率;alerting:配置Alertmanager地址;rule_files:指定告警规则文件;scrape_configs:定义监控任务(job),每个job对应一组监控目标。
3.2.3 创建系统服务
为了让Prometheus开机自启,创建systemd服务文件/usr/lib/systemd/system/prometheus.service:
[Unit]
Description=Prometheus Server
After=network.target

[Service]
Type=simple
User=root
ExecStart=/usr/local/prometheus/prometheus \
  --config.file=/usr/local/prometheus/prometheus.yml \
  --storage.tsdb.path=/data/prometheus \
  --web.listen-address=0.0.0.0:9090
Restart=on-failure

[Install]
WantedBy=multi-user.target
3.2.4 启动并验证
# 重新加载systemd配置
systemctl daemon-reload
# 启动Prometheus
systemctl start prometheus
# 设置开机自启
systemctl enable prometheus
# 检查状态
systemctl status prometheus
访问http://服务器IP:9090,进入Prometheus Web界面:
- 点击「Status」→「Targets」,可看到
prometheus和node_exporter两个job(node_exporter暂未安装,状态为down); - 在查询框输入
prometheus_build_info,点击「Execute」,可看到Prometheus的版本信息,说明自身监控正常。
3.3 安装Node Exporter(服务器指标采集)
Node Exporter是Prometheus官方提供的Exporter,用于采集Linux/Windows服务器的CPU、内存、磁盘、网络等指标。
3.3.1 下载并解压
wget https://github.com/prometheus/node_exporter/releases/download/v1.8.2/node_exporter-1.8.2.linux-amd64.tar.gz
tar -zxvf node_exporter-1.8.2.linux-amd64.tar.gz
mv node_exporter-1.8.2.linux-amd64 /usr/local/node_exporter
3.3.2 创建系统服务
编辑/usr/lib/systemd/system/node_exporter.service:
[Unit]
Description=Node Exporter
After=network.target

[Service]
Type=simple
User=root
ExecStart=/usr/local/node_exporter/node_exporter
Restart=on-failure

[Install]
WantedBy=multi-user.target
3.3.3 启动并验证
systemctl daemon-reload
systemctl start node_exporter
systemctl enable node_exporter
systemctl status node_exporter
访问http://服务器IP:9100/metrics,可看到大量服务器指标(如node_cpu_usage、node_memory_MemTotal_bytes)。 回到Prometheus Web界面,刷新Targets,node_exporter状态变为UP,说明采集成功。
3.4 安装Grafana
Grafana是可视化工具,能将Prometheus的时序数据转化为直观的仪表盘,支持自定义图表、告警、多数据源。
3.4.1 安装并启动
# 添加Grafana源
cat > /etc/yum.repos.d/grafana.repo << EOF
[grafana]
name=grafana
baseurl=https://packages.grafana.com/oss/rpm
repo_gpgcheck=1
enabled=1
gpgcheck=1
gpgkey=https://packages.grafana.com/gpg.key
sslverify=1
sslcacert=/etc/pki/tls/certs/ca-bundle.crt
EOF

# 安装Grafana
yum install -y grafana

# 启动并设置开机自启
systemctl start grafana-server
systemctl enable grafana-server
systemctl status grafana-server
3.4.2 配置Grafana数据源
- 访问
http://服务器IP:3000,默认账号/密码:admin/admin,首次登录需修改密码; - 点击左侧「Configuration」→「Data sources」→「Add data source」;
- 选择「Prometheus」,配置数据源信息:
- Name:Prometheus(自定义);
- URL:
http://localhost:9090(Prometheus Server地址); - 其余保持默认,点击「Save & test」,提示「Data source is working」说明配置成功。
3.4.3 导入官方仪表盘
Grafana社区提供了大量现成的仪表盘模板,无需从零制作。Node Exporter的官方模板ID是1860:
- 点击左侧「Dashboards」→「Import」;
- 在「Import via grafana.com」输入1860,点击「Load」;
- 选择刚才配置的Prometheus数据源,点击「Import」;
- 导入成功后,即可看到服务器的CPU、内存、磁盘、网络等指标的可视化图表,实时更新。
四、PromQL实战:从基础查询到高级分析
PromQL是Prometheus的核心,掌握它才能真正玩转监控。以下是常用的PromQL查询示例,均经过验证可直接使用。
4.1 基础查询
4.1.1 筛选指标
# 筛选所有GET请求的总请求数
http_requests_total{method="GET"}

# 筛选指定路径的POST请求数
http_requests_total{method="POST",path="/api/order"}

# 排除某个标签值(如排除测试环境)
http_requests_total{env!="test"}
4.1.2 计数器(Counter)计算增长率
Counter是只增不减的,直接查询无意义,需用rate()或irate()计算增长率:
rate():计算指定时间范围内的平均增长率(适合长期趋势);irate():计算最新两个数据点的瞬时增长率(适合实时监控)。
# 计算5分钟内HTTP请求的平均QPS
rate(http_requests_total[5m])

# 计算1分钟内POST请求的瞬时QPS
irate(http_requests_total{method="POST"}[1m])

# 统计5分钟内错误请求(status=5xx)的占比
sum(rate(http_requests_total{status=~"5.."}[5m])) / sum(rate(http_requests_total[5m])) * 100
4.1.3 仪表盘(Gauge)监控
Gauge可直接查询,也可结合avg()、max()等函数聚合:
# 查询当前服务器内存使用率
node_memory_usage_percent

# 查询集群中所有节点的平均CPU负载(1分钟)
avg(node_load1) by (instance)

# 查询磁盘使用率超过80%的节点
node_filesystem_usage_percent{mountpoint="/"} > 80
4.1.4 直方图(Histogram)计算分位数
Histogram通过bucket(分桶)存储数据,需用histogram_quantile()计算分位数:
# 计算95%的请求延迟(单位:秒)
histogram_quantile(0.95, sum(rate(http_request_duration_seconds_bucket[5m])) by (le))

# 计算99%的请求延迟,并按接口路径分组
histogram_quantile(0.99, sum(rate(http_request_duration_seconds_bucket[5m])) by (le, path))
4.2 高级查询:告警规则实战
告警规则是Prometheus的核心功能之一,通过PromQL定义告警条件,满足条件时触发告警。
4.2.1 创建告警规则文件
编辑/usr/local/prometheus/alert_rules.yml:
groups:
-name:server_alerts
rules:
# 告警规则1:CPU使用率超过80%持续5分钟
-alert:HighCPUUsage
    expr:avg(node_cpu_usage_percent)by(instance)>80
    for:5m
    labels:
      severity:warning
      env:production
    annotations:
      summary:"服务器{{ $labels.instance }} CPU使用率过高"
      description:"服务器{{ $labels.instance }} CPU使用率已超过80%(当前值:{{ $value }}%),持续时间5分钟。"
# 告警规则2:内存使用率超过90%持续3分钟
-alert:HighMemoryUsage
    expr:node_memory_usage_percent>90
    for:3m
    labels:
      severity:critical
      env:production
    annotations:
      summary:"服务器{{ $labels.instance }} 内存使用率过高"
      description:"服务器{{ $labels.instance }} 内存使用率已超过90%(当前值:{{ $value }}%),持续时间3分钟。"
# 告警规则3:磁盘根分区使用率超过85%
-alert:HighDiskUsage
    expr:node_filesystem_usage_percent{mountpoint="/"}>85
    for:1m
    labels:
      severity:critical
      env:production
    annotations:
      summary:"服务器{{ $labels.instance }} 磁盘根分区使用率过高"
      description:"服务器{{ $labels.instance }} 磁盘根分区使用率已超过85%(当前值:{{ $value }}%)。"
4.2.2 配置Prometheus加载告警规则
修改/usr/local/prometheus/prometheus.yml,在rule_files中添加告警规则文件:
rule_files:
  - "alert_rules.yml"
4.2.3 重启Prometheus并验证
systemctl restart prometheus
访问Prometheus Web界面,点击「Alerts」,可看到定义的3条告警规则,状态为「Inactive」(未触发)。若服务器CPU使用率超过80%持续5分钟,状态会变为「Firing」(触发)。
4.3 安装Alertmanager:告警通知分发
Alertmanager负责接收Prometheus的告警,进行去重、分组、静默、路由,最终发送到邮件、钉钉、微信等渠道。
4.3.1 下载并解压
wget https://github.com/prometheus/alertmanager/releases/download/v0.27.0/alertmanager-0.27.0.linux-amd64.tar.gz
tar -zxvf alertmanager-0.27.0.linux-amd64.tar.gz
mv alertmanager-0.27.0.linux-amd64 /usr/local/alertmanager
# 创建数据目录
mkdir -p /data/alertmanager
4.3.2 配置Alertmanager
编辑/usr/local/alertmanager/alertmanager.yml:
global:
  resolve_timeout:5m# 告警恢复后,5分钟内不再发送恢复通知

route:
group_by:['alertname','instance']# 按告警名称和实例分组
group_wait:10s# 分组等待时间,收集同组告警后一起发送
group_interval:10s# 同组告警再次发送的间隔
repeat_interval:1h# 重复发送告警的间隔
receiver:'email-receiver'# 默认接收者

receivers:
-name:'email-receiver'
email_configs:
-to:'your-email@example.com'# 接收告警的邮箱
    from:'alertmanager@example.com'# 发件人邮箱
    smarthost:'smtp.example.com:587'# SMTP服务器地址和端口
    auth_username:'alertmanager@example.com'# SMTP用户名
    auth_password:'your-smtp-password'# SMTP密码
    require_tls:true# 启用TLS

inhibit_rules:
-source_match:
      severity:'critical'
    target_match:
      severity:'warning'
    equal:['alertname','instance']# 当critical告警触发时,抑制同实例的warning告警
4.3.3 创建系统服务
编辑/usr/lib/systemd/system/alertmanager.service:
[Unit]
Description=Alertmanager
After=network.target

[Service]
Type=simple
User=root
ExecStart=/usr/local/alertmanager/alertmanager \
  --config.file=/usr/local/alertmanager/alertmanager.yml \
  --storage.path=/data/alertmanager
Restart=on-failure

[Install]
WantedBy=multi-user.target
4.3.4 配置Prometheus连接Alertmanager
修改/usr/local/prometheus/prometheus.yml,补充Alertmanager地址:
alerting:
  alertmanagers:
    - static_configs:
        - targets:
          - localhost:9093
4.3.5 启动并验证
systemctl daemon-reload
systemctl start alertmanager
systemctl enable alertmanager
systemctl status alertmanager
访问http://服务器IP:9093,进入Alertmanager Web界面,可查看告警状态、接收者配置等。当Prometheus触发告警时,Alertmanager会按配置发送邮件通知。
五、实战:监控Java应用(Spring Boot)
作为Java开发者,监控Spring Boot应用是高频需求。以下是完整的实现步骤。
5.1 配置Spring Boot应用暴露Prometheus指标
5.1.1 添加依赖
在Spring Boot项目的pom.xml中添加依赖(以Spring Boot 3.x为例):
<!-- Prometheus监控核心依赖 -->
<dependency>
    <groupId>org.springframework.boot</groupId>
    <artifactId>spring-boot-starter-actuator</artifactId>
</dependency>
<dependency>
    <groupId>io.micrometer</groupId>
    <artifactId>micrometer-registry-prometheus</artifactId>
</dependency>
5.1.2 配置application.yml
spring:
  application:
    name:demo-app

management:
endpoints:
    web:
      exposure:
        include:prometheus,health,info# 暴露prometheus端点
metrics:
    tags:
      application:${spring.application.name}# 为指标添加应用名称标签
    export:
      prometheus:
        enabled:true
endpoint:
    prometheus:
      enabled:true
5.1.3 启动应用并验证
启动Spring Boot应用,访问http://应用IP:端口/actuator/prometheus,可看到应用的指标(如jvm_memory_used_bytes、http_server_requests_seconds),说明指标暴露成功。
5.2 配置Prometheus采集Java应用指标
修改/usr/local/prometheus/prometheus.yml,添加Spring Boot应用的监控任务:
scrape_configs:
  # 省略已有配置...
-job_name:"spring_boot_app"
    static_configs:
      -targets:["应用IP:端口"]# Spring Boot应用地址
    metrics_path:"/actuator/prometheus"# 指标路径
    scrape_interval:10s# 采集频率
重启Prometheus:
systemctl restart prometheus
在Prometheus Web界面的Targets中,可看到spring_boot_app状态为UP,说明采集成功。
5.3 导入Spring Boot Grafana仪表盘
Grafana社区提供了Spring Boot应用的仪表盘模板,ID为12900:
- 进入Grafana,点击「Dashboards」→「Import」;
- 输入12900,点击「Load」;
- 选择Prometheus数据源,点击「Import」;
- 导入成功后,可看到JVM内存、GC、线程、接口请求等指标的可视化图表。
六、生产环境优化建议
6.1 Prometheus性能优化
- 数据保留策略:在prometheus.yml中配置
storage.tsdb.retention.time,根据业务需求设置保留时间(如15d),避免数据过多占用磁盘; - 远程存储:对于大规模集群,可配置远程存储(如Thanos、VictoriaMetrics),实现数据持久化和水平扩展;
- 分片采集:将监控目标分片到多个Prometheus实例,避免单实例压力过大。
6.2 告警优化
- 避免告警风暴:通过Alertmanager的
group_by、group_wait、inhibit_rules配置,减少重复告警; - 分级告警:按告警严重程度(warning/critical)配置不同的通知渠道(如warning发钉钉群,critical打电话);
- 静默规则:在发布、维护期间,配置静默规则,避免不必要的告警。
6.3 高可用配置
- Prometheus集群:部署多个Prometheus实例,通过联邦集群(Federation)实现数据同步;
- Alertmanager集群:部署多个Alertmanager实例,避免单点故障;
- 监控自身:用Prometheus监控Prometheus、Grafana、Alertmanager自身的指标,确保监控体系稳定。
七、常见问题排查
7.1 Prometheus Targets状态为Down
- 检查被监控目标是否启动,端口是否开放;
- 检查Prometheus的scrape_configs配置是否正确(如targets、metrics_path);
- 检查网络是否通畅,执行
curl 目标IP:端口/metrics,确认能获取指标数据。
7.2 Grafana图表无数据
- 检查Grafana的数据源配置是否正确,测试连接是否成功;
- 检查PromQL查询语句是否正确,在Prometheus Web界面验证查询结果;
- 检查采集频率是否过慢,或指标数据是否未生成。
7.3 告警未触发
- 检查Prometheus的告警规则是否正确,在「Alerts」页面查看规则状态;
- 检查PromQL表达式是否满足触发条件,在Prometheus查询框验证;
- 检查Alertmanager是否正常运行,是否配置了正确的接收者。
总结
- Prometheus+Grafana是云原生监控的黄金组合,Prometheus负责数据采集、存储、告警规则评估,Grafana负责可视化,Alertmanager负责告警分发;
- 核心知识点包括:时序数据、4种指标类型、Pull采集模式、PromQL查询语言,掌握这些才能灵活配置监控;
- 实战落地需遵循「安装→配置→验证→优化」的步骤,从监控服务器、Java应用入手,逐步扩展到全链路监控,同时做好生产环境的高可用和性能优化。
本文参与 腾讯云自媒体同步曝光计划,分享自微信公众号。
原始发表:2026-02-12,如有侵权请联系 cloudcommunity@tencent.com 删除
评论
登录后参与评论
推荐阅读
目录
腾讯云开发者

Copyright © 2013 - 2026 Tencent Cloud. All Rights Reserved. 腾讯云 版权所有
深圳市腾讯计算机系统有限公司 ICP备案/许可证号:粤B2-20090059 ![]() 粤公网安备44030502008569号
粤公网安备44030502008569号
腾讯云计算(北京)有限责任公司 京ICP证150476号 | 京ICP备11018762号