日志与监控:可观测性体系建设


作者: HOS(安全风信子) 日期: 2026-05-25 主要来源平台: GitHub 摘要: 可观测性是 AI IDE 稳定运行的基础,也是 DevOps 实践的核心组成部分。本文系统讲解日志、指标、追踪三大支柱的实现方法:包括结构化日志规范与日志级别设计、主流日志收集工具 Filebeat/Fluentd/Vector 的深度对比、Prometheus 客户端与 Pushgateway 的指标采集方案、OpenTelemetry 在分布式追踪中的应用,以及阈值告警、趋势告警、智能告警的实现策略。最后通过实际案例展示如何构建 AI IDE 的可观测性仪表盘,实现容量规划、性能优化与异常检测的闭环管理。
目录- 1. 可观测性架构概述
- 1.1 为什么 AI IDE 需要可观测性
- 1.2 可观测性三大支柱
- 1.3 可观测性数据流架构
- 2. 日志规范:结构化日志与日志级别
- 2.1 为什么需要结构化日志
- 2.2 日志级别规范
- 2.3 AI IDE 结构化日志规范
- 2.4 日志采样策略
- 3. 日志收集:Filebeat、Fluentd、Vector 对比
- 3.1 架构对比概述
- 3.2 Filebeat 深度解析
- 3.3 Fluentd 深度解析
- 3.4 Vector 深度解析
- 3.5 三大收集器深度对比
- 3.6 AI IDE 日志收集架构设计
- 4. 指标采集:Prometheus 客户端与 Pushgateway
- 4.1 Prometheus 数据模型
- 4.2 AI IDE 指标规范
- 4.3 Prometheus 服务器配置
- 4.4 Pushgateway 的正确使用方式
- 5. 追踪系统:OpenTelemetry 与 Trace 关联
- 5.1 分布式追踪基础
- 5.2 OpenTelemetry 架构
- 5.3 AI IDE OpenTelemetry 实现
- 5.4 AI IDE 业务追踪封装
- 5.5 OpenTelemetry Collector 配置
- 6. 告警系统:阈值告警、趋势告警、智能告警
- 6.1 告警分层架构
- 6.2 告警级别定义
- 6.3 Prometheus 告警规则
- 6.4 Alertmanager 配置
- 6.5 趋势告警与智能告警
- 7. 实践:构建 AI IDE 的可观测性仪表盘
- 7.1 Grafana Dashboard 设计原则
- 7.2 AI IDE 综合仪表盘
- 7.3 追踪数据可视化
- 7.4 日志关联分析
- 8. 可观测性最佳实践
- 8.1 关键设计原则
- 8.2 常见陷阱与规避
- 8.3 容量规划指南
- 9. 总结与展望
- A. 完整的 Prometheus Alertmanager 配置
- B. Grafana Dashboard 变量配置
- C. OpenTelemetry Collector 高可用配置
- D. 可观测性检查清单
- 1.1 为什么 AI IDE 需要可观测性
- 1.2 可观测性三大支柱
- 1.3 可观测性数据流架构
- 2.1 为什么需要结构化日志
- 2.2 日志级别规范
- 2.3 AI IDE 结构化日志规范
- 2.4 日志采样策略
- 3.1 架构对比概述
- 3.2 Filebeat 深度解析
- 3.3 Fluentd 深度解析
- 3.4 Vector 深度解析
- 3.5 三大收集器深度对比
- 3.6 AI IDE 日志收集架构设计
- 4.1 Prometheus 数据模型
- 4.2 AI IDE 指标规范
- 4.3 Prometheus 服务器配置
- 4.4 Pushgateway 的正确使用方式
- 5.1 分布式追踪基础
- 5.2 OpenTelemetry 架构
- 5.3 AI IDE OpenTelemetry 实现
- 5.4 AI IDE 业务追踪封装
- 5.5 OpenTelemetry Collector 配置
- 6.1 告警分层架构
- 6.2 告警级别定义
- 6.3 Prometheus 告警规则
- 6.4 Alertmanager 配置
- 6.5 趋势告警与智能告警
- 7.1 Grafana Dashboard 设计原则
- 7.2 AI IDE 综合仪表盘
- 7.3 追踪数据可视化
- 7.4 日志关联分析
- 8.1 关键设计原则
- 8.2 常见陷阱与规避
- 8.3 容量规划指南
1. 可观测性架构概述
本节为你提供的核心技术价值:理解可观测性三大支柱(日志、指标、追踪)的内在关联,掌握 AI IDE 可观测性体系的整体架构设计。
1.1 为什么 AI IDE 需要可观测性
AI IDE 作为一种复杂的人机交互系统,其可观测性建设面临独特挑战:
挑战维度 | 具体问题 | 可观测性需求 |
|---|---|---|
延迟敏感性 | 代码补全、语义分析需毫秒级响应 | 指标监控:P99/P999 延迟分布 |
资源消耗波动 | LLM 推理消耗不规则 | 资源指标与请求量关联分析 |
长连接维护 | 与 LLM 服务保持持久连接 | 连接状态追踪、心跳监控 |
多服务协作 | 编辑器、编译器、LLM 服务协同 | 分布式追踪、请求关联 |
异常定位困难 | AI 行为不可预测 | 结构化日志、上下文追踪 |
根据 Google SRE 手册[^1],可观测性系统的核心目标是:在系统发生问题时,能够快速定位问题根源,而不是依赖猜测。
1.2 可观测性三大支柱
可观测性(Observability)建立在三大支柱之上:日志(Logs)、指标(Metrics)、追踪(Traces)。
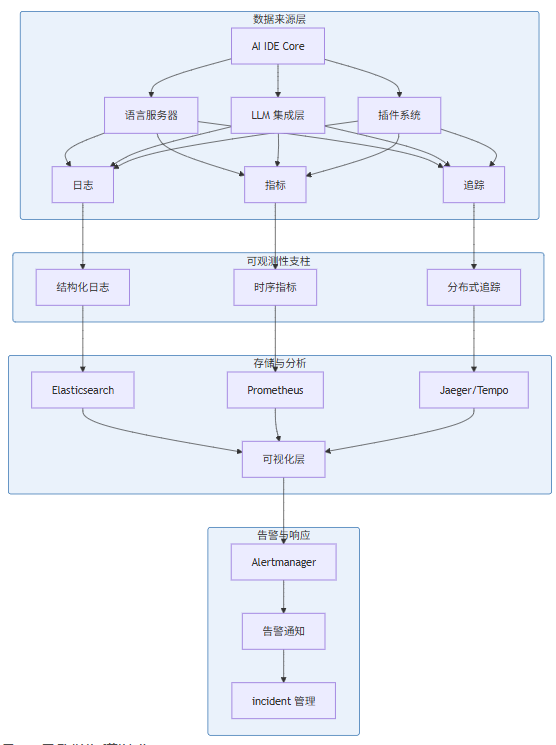
图 1-1:可观测性体系整体架构
三大支柱各有侧重:
- 日志(Logs):记录离散事件,提供问题诊断的上下文信息
- 指标(Metrics):聚合的数值数据,支持趋势分析和阈值告警
- 追踪(Traces):请求在分布式系统中的完整路径,支持因果分析
1.3 可观测性数据流架构
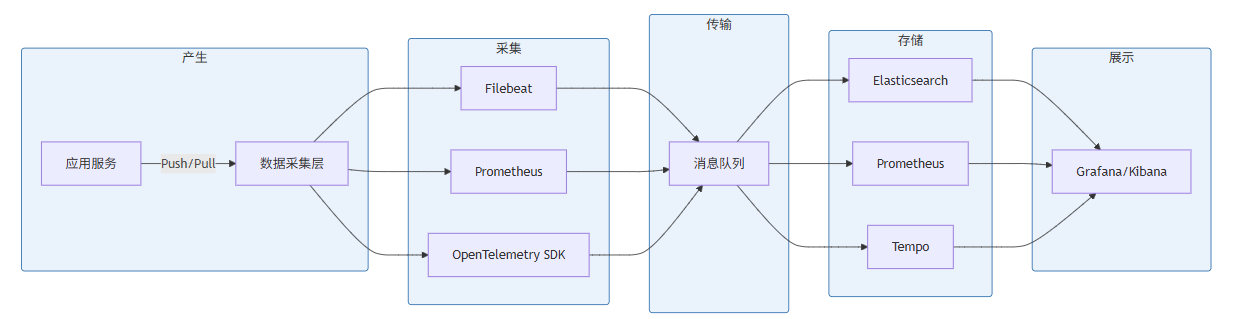
图 1-2:可观测性数据流架构
2. 日志规范:结构化日志与日志级别
本节为你提供的核心技术价值:掌握结构化日志设计原则,建立统一的日志级别规范,为后续日志收集与分析奠定基础。
2.1 为什么需要结构化日志
传统的文本日志(如 console.log、printf)虽然易于人类阅读,但在机器解析、规模化分析方面存在严重不足:
# 传统文本日志
2026-05-25 10:30:45 INFO [UserService] User 12345 logged in from IP 192.168.1.100

# 结构化日志(JSON)
{
  "timestamp": "2026-05-25T10:30:45.123Z",
  "level": "INFO",
  "service": "user-service",
  "user_id": 12345,
  "action": "login",
  "client_ip": "192.168.1.100",
  "duration_ms": 45,
  "trace_id": "abc123def456"
}
结构化日志的优势体现在:
特性 | 文本日志 | 结构化日志 |
|---|---|---|
机器解析 | 需要正则匹配 | JSON 直接解析 |
字段检索 | 全文本搜索 | 精确字段查询 |
统计分析 | 困难 | 容易聚合 |
扩展性 | 需改格式 | 增删字段无影响 |
存储成本 | 冗余信息多 | 按需索引 |
2.2 日志级别规范
AI IDE 的日志级别设计需要考虑多服务协作场景:
// 日志级别枚举定义
enum LogLevel {
  DEBUG = 0,    // 开发调试
  TRACE = 1,    // 详细跟踪
  INFO = 2,     // 一般信息
  WARN = 3,     // 警告
  ERROR = 4,    // 错误
  FATAL = 5,    // 致命错误
  PANIC = 6     // 系统崩溃
}各级别使用场景:
- DEBUG:开发环境详细调试信息,如变量值、循环次数
- TRACE:生产环境高频事件采样(如函数调用入口/出口)
- INFO:业务关键节点,如服务启动、请求处理完成
- WARN:潜在问题但不影响功能,如配置缺失使用默认值、重试成功
- ERROR:功能受损但服务可用,如单个请求失败、缓存未命中
- FATAL:进程级错误,如端口绑定失败、数据库连接断开
- PANIC:程序无法继续运行,如栈溢出、内存分配失败
2.3 AI IDE 结构化日志规范
以下是一个完整的 AI IDE 日志规范实现:
// src/observability/logger.ts
import pino from 'pino';

// 日志上下文接口
interface LogContext {
  service: string;          // 服务名称
  version?: string;        // 服务版本
  environment?: string;    // 运行环境
  traceId?: string;        // 追踪 ID
  spanId?: string;         // Span ID
  userId?: string;         // 用户 ID(脱敏)
  sessionId?: string;      // 会话 ID
  requestId?: string;      // 请求 ID
}

// 日志字段接口
interface LogFields {
  level: string;
  time: number;
  service: string;
  msg: string;
  traceId?: string;
  spanId?: string;
  userId?: string;
  duration_ms?: number;
  error?: {
    message: string;
    stack?: string;
    type: string;
  };
  metadata?: Record<string, unknown>;
}

class StructuredLogger {
  private logger: pino.Logger;
  private context: LogContext;

  constructor(context: LogContext) {
    this.context = context;
    this.logger = pino({
      level: process.env.LOG_LEVEL || 'info',
      formatters: {
        level: (label) => ({ level: label }),
        bindings: () => ({
          service: this.context.service,
          version: this.context.version,
          environment: this.context.environment
        })
      },
      timestamp: pino.stdTimeFunctions.isoTime,
      base: {
        pid: process.pid,
        hostname: process.env.HOSTNAME
      }
    });
  }

  // 创建带追踪上下文的子日志器
  child(bindings: Partial<LogContext>): StructuredLogger {
    const childLogger = new StructuredLogger({
      ...this.context,
      ...bindings
    });
    childLogger.logger = this.logger.child(bindings);
    return childLogger;
  }

  // 通用日志方法
  private log(level: string, message: string, meta?: Record<string, unknown>): void {
    this.logger[level](meta)(message);
  }

  debug(message: string, meta?: Record<string, unknown>): void {
    this.log('debug', message, meta);
  }

  info(message: string, meta?: Record<string, unknown>): void {
    this.log('info', message, meta);
  }

  warn(message: string, meta?: Record<string, unknown>): void {
    this.log('warn', message, meta);
  }

  error(message: string, error?: Error, meta?: Record<string, unknown>): void {
    const errorMeta = error ? {
      error: {
        message: error.message,
        stack: error.stack,
        type: error.constructor.name
      },
      ...meta
    } : meta;
    this.log('error', message, errorMeta);
  }

  fatal(message: string, error?: Error, meta?: Record<string, unknown>): void {
    const errorMeta = error ? {
      error: {
        message: error.message,
        stack: error.stack,
        type: error.constructor.name
      },
      ...meta
    } : meta;
    this.log('fatal', message, errorMeta);
  }

  // AI IDE 特定业务日志方法
  logLLMRequest(model: string, promptTokens: number, completionTokens: number, duration_ms: number): void {
    this.info('LLM request completed', {
      event: 'llm_request',
      model,
      prompt_tokens: promptTokens,
      completion_tokens: completionTokens,
      total_tokens: promptTokens + completionTokens,
      duration_ms
    });
  }

  logCodeCompletion(triggerKind: string, completionTime_ms: number, itemsReturned: number): void {
    this.info('Code completion', {
      event: 'code_completion',
      trigger_kind: triggerKind,
      completion_time_ms: completionTime_ms,
      items_returned: itemsReturned
    });
  }

  logSemanticAnalysis(fileUri: string, duration_ms: number, diagnosticsCount: number): void {
    this.info('Semantic analysis completed', {
      event: 'semantic_analysis',
      file_uri: fileUri,
      duration_ms,
      diagnostics_count: diagnosticsCount
    });
  }
}

// 工厂函数
export function createLogger(context: LogContext): StructuredLogger {
  return new StructuredLogger(context);
}

// 默认日志实例
export const rootLogger = createLogger({
  service: 'ai-ide',
  version: process.env.VERSION || 'dev',
  environment: process.env.NODE_ENV || 'development'
});
2.4 日志采样策略
在高频场景(如 AI IDE 的实时分析)中,全量日志会造成存储压力。采样策略是必要的:
// src/observability/log-sampler.ts

interface SamplingRule {
  pattern: RegExp;
  rate: number;  // 0-1 的采样率
  burst: number; // 突发采样阈值
}

class AdaptiveSampler {
  private rules: SamplingRule[] = [];
  private counters: Map<string, number> = new Map();
  private lastReset: number = Date.now();

  constructor(rules: SamplingRule[]) {
    this.rules = rules;
  }

  shouldSample(level: string, message: string, metadata: Record<string, unknown>): boolean {
    // 动态调整:ERROR 级别以上必采样
    if (['ERROR', 'FATAL', 'WARN'].includes(level)) {
      return true;
    }

    // 匹配采样规则
    for (const rule of this.rules) {
      if (rule.pattern.test(message)) {
        const key = rule.pattern.source;
        const count = (this.counters.get(key) || 0) + 1;
        this.counters.set(key, count);

        // 突发流量检测:超过阈值时增加采样
        if (count > rule.burst) {
          return true; // 100% 采样突发
        }

        // 正常采样率
        return Math.random() < rule.rate;
      }
    }

    // 默认采样率
    return Math.random() < 0.01; // 1%
  }

  reset(): void {
    this.counters.clear();
    this.lastReset = Date.now();
  }
}

// 使用示例
const sampler = new AdaptiveSampler([
  { pattern: /LLM request/i, rate: 0.1, burst: 100 },
  { pattern: /code completion/i, rate: 0.05, burst: 200 },
  { pattern: /semantic analysis/i, rate: 0.02, burst: 50 }
]);
3. 日志收集:Filebeat、Fluentd、Vector 对比
本节为你提供的核心技术价值:深入理解三大日志收集器的架构差异,根据 AI IDE 的实际场景做出合理的技术选型。
3.1 架构对比概述
特性 | Filebeat | Fluentd | Vector |
|---|---|---|---|
开发语言 | Go | Ruby (C++) | Rust |
内存占用 | ~10MB | ~40-80MB | ~20MB |
吞吐量 | 中等 | 中等 | 高 |
配置格式 | YAML | Ruby DSL/YAML | TOML/YAML |
背压处理 | 支持 | 支持 | 支持 |
可靠性 | At-least-once | At-least-once | Exactly-once |
插件生态 | 丰富 | 极其丰富 | 增长中 |
性能 | 8K events/s | 5K events/s | 20K+ events/s |
3.2 Filebeat 深度解析
Filebeat 是 Elastic Stack 生态中的轻量级日志收集器,特别适合与 Elasticsearch 配合使用。
# filebeat.yml for AI IDE
filebeat.inputs:
  # LLM 服务日志
  - type: log
    enabled: true
    paths:
      - /var/log/ai-ide/llm*.log
    json.keys_under_root: true
    json.add_error_key: true
    fields:
      service: llm-integrator
      log_type: application
    fields_under_root: true

  # 语言服务器日志
  - type: log
    enabled: true
    paths:
      - /var/log/ai-ide/lsp*.log
    multiline.pattern: '^\d{4}-\d{2}-\d{2}'
    multiline.negate: true
    multiline.match: after
    fields:
      service: language-server
      log_type: application
    fields_under_root: true

  # 系统日志
  - type: log
    enabled: true
    paths:
      - /var/log/syslog
    include_lines: ['error', 'warning', 'critical']
    fields:
      service: system
      log_type: syslog
    fields_under_root: true

processors:
  - add_host_metadata:
      when.not.contains.tags: forwarded
  - add_cloud_metadata: ~
  - add_docker_metadata: ~
  - timestamp:
      field: json.time
      layouts:
        - '2006-01-02T15:04:05.000Z'
        - '2006-01-02T15:04:05Z'
  - drop_fields:
      fields: ["log", "host", "agent", "ecs"]
      ignore_missing: true

output.elasticsearch:
  hosts: ["elasticsearch:9200"]
  index: "ai-ide-logs-%{+yyyy.MM.dd}"
  pipeline: "ai-ide-logs-pipeline"

setup.template.name: "ai-ide-logs"
setup.template.pattern: "ai-ide-logs-*"
setup.template.settings:
  index.number_of_shards: 3
  index.number_of_replicas: 1

# ILM 生命周期管理
setup.ilm.enabled: true
setup.ilm.rollover_alias: "ai-ide-logs"
setup.ilm.pattern: "{now/d}-000001"
setup.ilm.policy_name: "ai-ide-logs-policy"

# 高级特性:队列配置
queue.mem:
  events: 8192
  flush.min_events: 512
  flush.timeout: 1s

# 负载限制
max_procs: 4
Filebeat 关键配置说明:
json.keys_under_root:将 JSON 字段提升到根级别,便于 Kibana 直接搜索multiline:处理跨行的堆栈跟踪queue.mem:内存队列配置,平衡吞吐与可靠性ILM:索引生命周期管理,自动管理冷热数据
3.3 Fluentd 深度解析
Fluentd 采用统一的日志层(Unified Logging Layer)理念,通过插件系统连接各种数据源和数据目的地。
# fluent.conf for AI IDE
<source>
  @type tail
  @id input-tail-llm
  path /var/log/ai-ide/llm*.log
  pos_file /var/log/fluent/llm.log.pos
  tag ai-ide.llm
  <parse>
    @type json
    time_type string
    time_format %Y-%m-%dT%H:%M:%S.%L%z
  </parse>
</source>

<source>
  @type tail
  @id input-tail-lsp
  path /var/log/ai-ide/lsp*.log
  pos_file /var/log/fluent/lsp.log.pos
  tag ai-ide.lsp
  <parse>
    @type multiline
    format_firstline /^\d{4}-\d{2}-\d{2}/
    format1 /^(?<time>[^ ]+) (?<level>\w+) \[(?<source>[^\]]+)\] (?<message>.*)$/
  </parse>
</source>

<source>
  @type systemd
  @id input-systemd-ai-ide
  filters [{ " Matches": { "_SYSTEMD_UNIT": "ai-ide.service" } }]
  tag ai-ide.systemd
  <storage>
    @type local
    persistent true
    path /var/log/fluent/systemd.pos
  </storage>
  read_from_head true
</source>

# LLM 日志处理管道
<filter ai-ide.llm.**>
  @type record_transformer
  enable_ruby true
  <record>
    service "llm-integrator"
    environment "#{ENV['ENVIRONMENT'] || 'development'}"
    @timestamp ${time}
  </record>
</filter>

<filter ai-ide.llm.**>
  @type prometheus
  <metric>
    name llm_request_duration_seconds
    type histogram
    desc LLM request duration
    key duration_ms
    buckets [0.1, 0.5, 1.0, 2.0, 5.0, 10.0]
  </metric>
</filter>

# LSP 日志处理管道
<filter ai-ide.lsp.**>
  @type parser
  @id parser-lsp
  key_name message
  <parse>
    @type regexp
    expression /^(?<method>\w+) (?<file_uri>\S+) (?<duration_ms>\d+)ms$/
  </parse>
  <record>
    parsed_method ${method}
    parsed_duration ${duration_ms}
  </record>
</filter>

# 聚合与路由
<match ai-ide.**>
  @type copy
  <store>
    @type elasticsearch
    host elasticsearch
    port 9200
    index_name ai-ide-logs
    type_name _doc
    logstash_format true
    logstash_prefix ai-ide
    logstash_dateformat %Y.%m.%d
    include_tag_key true
    <buffer>
      @type file
      path /var/log/fluent/elasticsearch.buffer
      flush_mode interval
      flush_interval 10s
      chunk_limit_size 8MB
      queue_limit_length 256
      overflow_action block
    </buffer>
  </store>
  <store>
    @type stdout
    @id stdout-plugin
  </store>
  <store>
    @type relabel
    @id relabel-for-metrics
    <label>
      ai-ide-metrics
    </label>
  </store>
</match>

# Prometheus 指标输出
<match ai-ide-metrics>
  @type prometheus
  port 24231
  metrics_path /metrics
</match>

# 死信队列处理
<match ai-ide.**>
  @type file
  @id dq-output
  path /var/log/fluent/dq/ai-ide
  append true
  <buffer>
    @type file
    path /var/log/fluent/dq/ai-ide.buffer
    flush_mode periodic
    flush_interval 60s
  </buffer>
</filter>
Fluentd 关键特性说明:
- 多数据源支持:通过
@type tail、@type systemd、@type http等接入不同日志 - 强大的过滤能力:record_transformer、parser、filter 插件支持复杂的数据转换
- 死信队列:防止数据丢失,支持故障恢复
- 缓冲配置:
buffer插件支持多种背压策略
3.4 Vector 深度解析
Vector 是新一代高性能日志/指标收集器,由 Datadog 主导开发,以 Rust 编写提供卓越性能。
# vector.toml for AI IDE

[sources.ai_ide_logs]
type = "file"
include = ["/var/log/ai-ide/*.log"]
exclude = ["/var/log/ai-ide/debug.log"]
read_from = "start"
fingerprints = ["algorithm"]
ignore_older_secs = 86400

[sources.ai_ide_json_logs]
type = "file"
include = ["/var/log/ai-ide/**/*.json"]
read_from = "start"
json = true

[sources.host_metrics]
type = "host_metrics"
召回 = ["cpu", "memory", "network", "disk"]
namespace = "ai_ide"

[sources.internal_metrics]
type = "internal_metrics"
scrape_interval_secs = 15

# Transform: 日志解析
[transforms.parse_ai_ide_logs]
type = "remap"
inputs = ["ai_ide_logs"]
source = '''
. = parse_json!(.message) ?? .message
.timestamp = parse_timestamp!(.timestamp ?? now(), format: "%Y-%m-%dT%H:%M:%S%.f%:z")
.level = upcase(.level)
.service = get_env_var("SERVICE_NAME") ?? "ai-ide"
'''

[transforms.parse_llm_logs]
type = "remap"
inputs = ["ai_ide_json_logs"]
filter = 'includes(["llm", "llm-integrator"], .service)'
source = '''
.duration_s = .duration_ms / 1000
.total_tokens = .prompt_tokens + .completion_tokens
.tokens_per_second = .total_tokens / .duration_s
.token_efficiency = .completion_tokens / .total_tokens
'''

[transforms.enrich_metadata]
type = "aws_ec2_metadata"
inputs = ["parse_ai_ide_logs"]
refresh_interval_secs = 300

[transforms.add_trace_context]
type = "lua"
inputs = ["parse_ai_ide_logs"]
source = '''
if .trace_id == nil then
  .trace_id = random_uuid()
end
if .span_id == nil then
  .span_id = random_uuid()
end
'''

# Transform: 指标提取
[transforms.extract_metrics]
type = "metric_to_log"
inputs = ["host_metrics"]

[transforms.aggregate_metrics]
type = "reduce"
inputs = ["extract_metrics"]
group_by = ["host", "metric_name"]
reduce_merge_strategies = ["sum"]

# Sink: Elasticsearch
[sinks.ai_ide_elasticsearch]
type = "elasticsearch"
inputs = ["parse_ai_ide_logs", "parse_llm_logs", "enrich_metadata", "add_trace_context"]
endpoint = "http://elasticsearch:9200"
index = "ai-ide-logs-%Y.%m.%d"
bulk_action = "{{ action }}"
compression = true
encoding.codec = "json"
buffer = "disk"
buffer.max_size = 5368704000
buffer.type = "disk"
buffer.max_events = 10000
buffer.when_full = "block"

[sinks.ai_ide_dedicated_index]
type = "elasticsearch"
inputs = ["parse_llm_logs"]
endpoint = "http://elasticsearch:9200"
index = "ai-ide-llm-logs-%Y.%m.%d"
document_id = "{{ trace_id }}"

# Sink: Prometheus Remote Write
[sinks.prometheus_remote]
type = "prometheus_remote_write"
inputs = ["host_metrics", "internal_metrics"]
endpoint = "http://prometheus:9090/api/v1/write"
external_data_dir = "/var/vector/external"
healthcheck = true
buffer = "memory"
buffer.max_events = 5000
buffer.when_full = "drop_newest"

# Sink: Loki
[sinks.loki]
type = "loki"
inputs = ["parse_ai_ide_logs"]
endpoint = "http://loki:3100"
labels = {
  service = "{{ service }}",
  environment = "{{ environment }}",
  level = "{{ level }}"
}
batch.max_events = 1000
batch.timeout_secs = 10
out_of_order_action = "rewrite_timestamp"

# Sink: Stdout (开发调试)
[sinks.stdout]
type = "console"
inputs = ["parse_ai_ide_logs"]
encoding.codec = "json"

# 健康检查端点
[api]
enabled = true
address = "0.0.0.0:9001"
Vector 关键特性说明:
- 性能指标:单实例可达 20K+ events/s,内存占用极低
- Exactly-once:通过磁盘缓冲实现精确一次语义
- 拓扑配置:清晰的数据流配置,从 source 到 transform 到 sink
- 自动 fingerprint:智能检测日志轮转
3.5 三大收集器深度对比
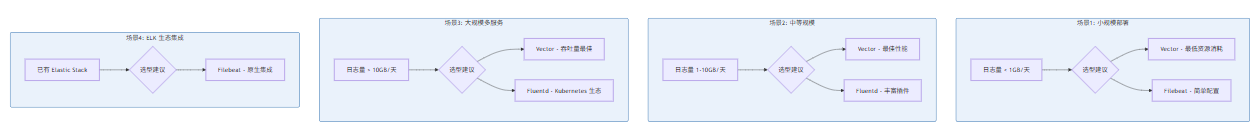
图 3-1:日志收集器选型决策树
3.6 AI IDE 日志收集架构设计
基于上述分析,我们为 AI IDE 设计如下日志收集架构:
# docker-compose.yml for AI IDE Logging Infrastructure

version: '3.8'

services:
  # 日志收集层
  vector:
    image: timberio/vector:0.34.0
    container_name: ai-ide-vector
    volumes:
      - ./vector/vector.toml:/etc/vector/vector.toml:ro
      - ./vector/data:/var/vector/data
      - /var/run/docker.sock:/var/run/docker.sock
      - /var/log/ai-ide:/var/log/ai-ide:ro
    ports:
      - "9001:9001"  # Vector API
    environment:
      - VECTOR_CONFIG=/etc/vector/vector.toml
    networks:
      - observability
    restart: unless-stopped
    deploy:
      resources:
        limits:
          cpus: '2.0'
          memory: 512M
        reservations:
          cpus: '0.5'
          memory: 128M

  # 日志存储层
  elasticsearch:
    image: docker.elastic.co/elasticsearch/elasticsearch:8.11.0
    container_name: ai-ide-elasticsearch
    environment:
      - discovery.type=single-node
      - xpack.security.enabled=false
      - "ES_JAVA_OPTS=-Xms2g -Xmx2g"
      - cluster.name=ai-ide-logs
      - indices.memory.index_buffer_size=20%
      - indices.queries.cache.size=15%
    volumes:
      - es_data:/usr/share/elasticsearch/data
    ports:
      - "9200:9200"
      - "9300:9300"
    networks:
      - observability
    restart: unless-stopped
    deploy:
      resources:
        limits:
          cpus: '4.0'
          memory: 4G

  # 日志可视化
  kibana:
    image: docker.elastic.co/kibana/kibana:8.11.0
    container_name: ai-ide-kibana
    environment:
      - ELASTICSEARCH_HOSTS=http://elasticsearch:9200
      - XPACK_SECURITY_ENABLED=false
      - SERVER_NAME=ai-ide-kibana
    ports:
      - "5601:5601"
    depends_on:
      - elasticsearch
    networks:
      - observability
    restart: unless-stopped

  # 日志索引管理
  elasticsearch-index-manager:
    image: docker.elastic.co/elasticsearch/elasticsearch:8.11.0
    container_name: ai-ide-es-index-manager
    command: >
      bash -c '
        # 创建 ILM 策略
        curl -X PUT "elasticsearch:9200/_ilm/policy/ai-ide-logs-policy" -H "Content-Type: application/json" -d"
        {
          \"policy\": {
            \"phases\": {
              \"hot\": {
                \"min_age\": \"0ms\",
                \"actions\": {
                  \"rollover\": {
                    \"max_age\": \"1d\",
                    \"max_primary_shard_size\": \"50gb\"
                  }
                }
              },
              \"warm\": {
                \"min_age\": \"7d\",
                \"actions\": {
                  \"shrink\": { \"number_of_shards\": 1 },
                  \"forcemerge\": { \"max_num_segments\": 1 }
                }
              },
              \"cold\": {
                \"min_age\": \"30d\",
                \"actions\": {
                  \"searchable_snapshot\": {
                    \"snapshot_repository\": \"ai-ide-snapshots\"
                  }
                }
              },
              \"delete\": {
                \"min_age\": \"365d\",
                \"actions\": { \"delete\": {} }
              }
            }
          }
        }"
      '
    depends_on:
      - elasticsearch
    networks:
      - observability
    restart: "no"

networks:
  observability:
    driver: bridge

volumes:
  es_data:
    driver: local
4. 指标采集:Prometheus 客户端与 Pushgateway
本节为你提供的核心技术价值:掌握 Prometheus 指标模型与客户端库使用方法,理解 Pushgateway 的适用场景与最佳实践。
4.1 Prometheus 数据模型
Prometheus 采用时序数据库模型存储指标数据:
<metric_name>{<label_name>=<label_value>, ...}四种核心指标类型:
类型 | 说明 | 典型使用场景 |
|---|---|---|
Counter | 只能递增的计数器 | 请求总数、错误计数 |
Gauge | 可任意增减的值 | CPU使用率、内存占用 |
Histogram | 统计分布的桶 | 请求延迟分布 |
Summary | 百分位数统计 | 响应时间 P50/P90/P99 |
4.2 AI IDE 指标规范
// src/observability/metrics/index.ts
import { Registry, Counter, Gauge, Histogram, Summary } from 'prom-client';

// 创建注册表
const register = new Registry();

// 添加默认标签
register.setDefaultLabels({
  app: 'ai-ide',
  version: process.env.VERSION || 'dev'
});

// 收集默认指标
import { collectDefaultMetrics } from 'prom-client';
collectDefaultMetrics({ register });

// ============ AI IDE 业务指标 ============

// 1. LLM 集成层指标
export const llmRequestCounter = new Counter({
  name: 'ai_ide_llm_requests_total',
  help: 'Total number of LLM requests',
  labelNames: ['model', 'status', 'error_type'] as const,
  registers: [register]
});

export const llmRequestDuration = new Histogram({
  name: 'ai_ide_llm_request_duration_seconds',
  help: 'LLM request duration in seconds',
  labelNames: ['model', 'operation'] as const,
  buckets: [0.1, 0.5, 1, 2, 5, 10, 30, 60],
  registers: [register]
});

export const llmTokensTotal = new Counter({
  name: 'ai_ide_llm_tokens_total',
  help: 'Total number of tokens processed',
  labelNames: ['model', 'type'] as const,  // type: prompt | completion
  registers: [register]
});

export const llmTokenUsage = new Gauge({
  name: 'ai_ide_llm_token_usage',
  help: 'Current token usage by model',
  labelNames: ['model', 'quota_type'] as const,
  registers: [register]
});

// 2. 语言服务器指标
export const lspRequestCounter = new Counter({
  name: 'ai_ide_lsp_requests_total',
  help: 'Total number of LSP requests',
  labelNames: ['method', 'status'] as const,
  registers: [register]
});

export const lspRequestDuration = new Histogram({
  name: 'ai_ide_lsp_request_duration_seconds',
  help: 'LSP request duration in seconds',
  labelNames: ['method'] as const,
  buckets: [0.001, 0.005, 0.01, 0.05, 0.1, 0.5, 1, 5],
  registers: [register]
});

export const lspActiveDocuments = new Gauge({
  name: 'ai_ide_lsp_active_documents',
  help: 'Number of currently open documents',
  registers: [register]
});

export const lspDiagnosticsCount = new Gauge({
  name: 'ai_ide_lsp_diagnostics_count',
  help: 'Number of diagnostics per severity',
  labelNames: ['severity'] as const,  // error, warning, info, hint
  registers: [register]
});

// 3. 代码补全指标
export const completionCounter = new Counter({
  name: 'ai_ide_completions_total',
  help: 'Total number of code completions',
  labelNames: ['trigger_kind', 'accepted'] as const,
  registers: [register]
});

export const completionDuration = new Histogram({
  name: 'ai_ide_completion_duration_seconds',
  help: 'Code completion request duration',
  labelNames: ['trigger_kind'] as const,
  buckets: [0.01, 0.05, 0.1, 0.25, 0.5, 1, 2.5],
  registers: [register]
});

export const completionItemsCount = new Histogram({
  name: 'ai_ide_completion_items_count',
  help: 'Number of completion items returned',
  labelNames: ['trigger_kind'] as const,
  buckets: [1, 5, 10, 20, 50, 100],
  registers: [register]
});

// 4. 系统资源指标
export const activeConnections = new Gauge({
  name: 'ai_ide_active_connections',
  help: 'Number of active WebSocket connections',
  registers: [register]
});

export const queueSize = new Gauge({
  name: 'ai_ide_queue_size',
  help: 'Current size of processing queues',
  labelNames: ['queue_name'] as const,
  registers: [register]
});

export const cacheHitRate = new Gauge({
  name: 'ai_ide_cache_hit_rate',
  help: 'Cache hit rate',
  labelNames: ['cache_name'] as const,
  registers: [register]
});

// 5. 健康检查指标
export const healthCheckDuration = new Summary({
  name: 'ai_ide_health_check_duration_seconds',
  help: 'Health check duration',
  labelNames: ['check_name'] as const,
  percentiles: [0.5, 0.9, 0.99],
  registers: [register]
});

// ============ 辅助函数 ============

export interface MetricsContext {
  model?: string;
  method?: string;
  triggerKind?: string;
  status?: string;
  errorType?: string;
}

export function recordLLMRequest(
  durationSeconds: number,
  context: { model: string; status: string; errorType?: string }
): void {
  llmRequestCounter.inc({
    model: context.model,
    status: context.status,
    error_type: context.errorType || 'none'
  });

  llmRequestDuration.observe(
    { model: context.model, operation: 'inference' },
    durationSeconds
  );
}

export function recordTokens(model: string, promptTokens: number, completionTokens: number): void {
  llmTokensTotal.inc({ model, type: 'prompt' }, promptTokens);
  llmTokensTotal.inc({ model, type: 'completion' }, completionTokens);
}

export function recordLSPRequest(
  method: string,
  durationSeconds: number,
  status: string
): void {
  lspRequestCounter.inc({ method, status });
  lspRequestDuration.observe({ method }, durationSeconds);
}

export function recordCompletion(
  triggerKind: string,
  durationSeconds: number,
  itemsCount: number,
  accepted: boolean
): void {
  completionCounter.inc({ trigger_kind: triggerKind, accepted });
  completionDuration.observe({ trigger_kind: triggerKind }, durationSeconds);
  completionItemsCount.observe({ trigger_kind: triggerKind }, itemsCount);
}

// 导出注册表供 /metrics 端点使用
export { register };
4.3 Prometheus 服务器配置
# prometheus.yml
global:
  scrape_interval: 15s
  evaluation_interval: 15s
  external_labels:
    cluster: 'ai-ide-production'
    env: 'production'

alerting:
  alertmanagers:
    - static_configs:
        - targets:
            - alertmanager:9093

rule_files:
  - "alerts/*.yml"
  - "recording_rules/*.yml"

scrape_configs:
  # AI IDE Core 服务
  - job_name: 'ai-ide-core'
    static_configs:
      - targets: ['ai-ide-core:9090']
    metrics_path: '/metrics'
    scheme: 'http'
    relabel_configs:
      - source_labels: [__address__]
        target_label: instance
        regex: '([^:]+):\d+'
        replacement: '${1}'
    sample_limit: 10000

  # LLM 集成服务
  - job_name: 'ai-ide-llm'
    static_configs:
      - targets: ['ai-ide-llm:9090']
    metric_relabel_configs:
      - source_labels: [__name__]
        regex: 'ai_ide_llm_.*'
        action: keep

  # 语言服务器集群
  - job_name: 'ai-ide-lsp'
    static_configs:
      - targets:
          - 'lsp-node-1:9090'
          - 'lsp-node-2:9090'
          - 'lsp-node-3:9090'
    scrape_interval: 10s

  # Pushgateway(用于批量/批处理作业指标)
  - job_name: 'ai-ide-batch'
    pushgateway: true
    static_configs:
      - targets: ['pushgateway:9091']
    honor_labels: true
    scrape_interval: 30s

  # 基础设施监控
  - job_name: 'node-exporter'
    static_configs:
      - targets: ['node-exporter:9100']

  - job_name: 'cadvisor'
    static_configs:
      - targets: ['cadvisor:8080']

  # Vector 自身指标
  - job_name: 'vector'
    static_configs:
      - targets: ['vector:9001']

  # Elasticsearch
  - job_name: 'elasticsearch'
    static_configs:
      - targets: ['elasticsearch:9114']
    params:
      auth: ['elastic', 'changeme']

  # 远程写入(兼容其他 Prometheus)
  - job_name: 'federate'
    static_configs:
      - targets: ['remote-prometheus:9090']
    metrics_path: '/federate'
    params:
      'match[]':
        - '{job="ai-ide"}'
    scrape_interval: 30s

# Recording rules(预计算常用查询)
recording_rules:
  - name: 'ai_ide_slo'
    rules:
      - record: 'job:ai_ide_llm_request_duration_p99:5m'
        expr: 'histogram_quantile(0.99, rate(ai_ide_llm_request_duration_seconds_bucket[5m]))'

      - record: 'job:ai_ide_llm_requests_per_minute:5m'
        expr: 'rate(ai_ide_llm_requests_total[5m]) * 60'

      - record: 'job:ai_ide_error_rate:5m'
        expr: 'rate(ai_ide_llm_requests_total{status="error"}[5m]) / rate(ai_ide_llm_requests_total[5m])'

# Alertmanager 配置
alerting:
  alertmanagers:
    - static_configs:
        - targets:
            - alertmanager:9093

rule_files:
  - "rules/ai-ide-alerts.yml"
  - "rules/ai-ide-recording.yml"
4.4 Pushgateway 的正确使用方式
Pushgateway 适用于无法被 Prometheus 直接抓取的作业指标,如短生命周期任务、批处理作业。
// src/observability/batch-metrics.ts
import { Registry, Counter, Gauge, Histogram, pushgateway } from 'prom-client';
import { Pushgateway } from 'prom-client';

const pushgateway = new Pushgateway('http://pushgateway:9091', {}, register);

// 批处理作业指标
const batchJobDuration = new Histogram({
  name: 'ai_ide_batch_job_duration_seconds',
  help: 'Batch job duration in seconds',
  labelNames: ['job_name', 'job_id'] as const,
  buckets: [1, 10, 60, 300, 900, 1800, 3600],
  registers: [register]
});

const batchJobProcessed = new Counter({
  name: 'ai_ide_batch_job_processed_total',
  help: 'Total number of processed items',
  labelNames: ['job_name', 'job_id', 'status'] as const,
  registers: [register]
});

const batchJobErrors = new Counter({
  name: 'ai_ide_batch_job_errors_total',
  help: 'Total number of job errors',
  labelNames: ['job_name', 'error_type'] as const,
  registers: [register]
});

// 批量推送函数
async function pushMetrics(jobName: string, jobId: string): Promise<void> {
  try {
    await pushgateway.pushAdd({ jobName, groupings: { job_id: jobId } });
  } catch (error) {
    console.error('Failed to push metrics:', error);
  }
}

// 作业完成时推送
async function pushJobCompletion(
  jobName: string,
  jobId: string,
  durationSeconds: number,
  processedCount: number,
  errorCount: number
): Promise<void> {
  // 记录指标
  batchJobDuration.observe({ job_name: jobName, job_id: jobId }, durationSeconds);
  batchJobProcessed.inc({ job_name: jobName, job_id: jobId, status: 'success' }, processedCount);

  if (errorCount > 0) {
    batchJobErrors.inc({ job_name: jobName, error_type: 'processing' }, errorCount);
  }

  // 推送到 Pushgateway
  try {
    await pushgateway.pushAdd({
      jobName,
      groupings: { job_id: jobId }
    });
  } catch (error) {
    console.error(`Failed to push metrics for job ${jobName}/${jobId}:`, error);
  }
}

// 作业失败时推送错误指标
async function pushJobError(
  jobName: string,
  jobId: string,
  errorType: string
): Promise<void> {
  batchJobErrors.inc({ job_name: jobName, error_type: errorType });

  try {
    await pushgateway.pushAdd({
      jobName,
      groupings: { job_id: jobId }
    });
  } catch (error) {
    console.error(`Failed to push error metrics for job ${jobName}/${jobId}:`, error);
  }
}

// 使用示例:批量索引项目文件
async function indexProjectFiles(jobId: string, filePaths: string[]): Promise<void> {
  const startTime = Date.now();
  let processed = 0;
  let errors = 0;

  for (const filePath of filePaths) {
    try {
      await indexFile(filePath);
      processed++;

      // 每处理 100 个文件推送一次进度
      if (processed % 100 === 0) {
        await pushMetrics('project-indexer', jobId);
      }
    } catch (error) {
      errors++;
      await pushJobError('project-indexer', jobId, categorizeError(error));
    }
  }

  const durationSeconds = (Date.now() - startTime) / 1000;
  await pushJobCompletion('project-indexer', jobId, durationSeconds, processed, errors);
}
Pushgateway 使用注意事项:
场景 | 推荐做法 | 避免做法 |
|---|---|---|
长时间运行服务 | 使用 Pull(直接暴露 /metrics) | 不必要地使用 Pushgateway |
短生命周期作业 | Pushgateway | 作业结束时指标丢失 |
批处理作业 | Pushgateway | 作业期间无法被抓取 |
避免指标残留 | 作业完成后删除 | 作业结束后指标仍显示 |
# Pushgateway 配置(用于生产环境)
apiVersion: apps/v1
kind: Deployment
metadata:
  name: pushgateway
  namespace: ai-ide-monitoring
spec:
  replicas: 2
  selector:
    matchLabels:
      app: pushgateway
  template:
    metadata:
      labels:
        app: pushgateway
    spec:
      containers:
        - name: pushgateway
          image: prom/pushgateway:latest
          ports:
            - containerPort: 9091
          args:
            - --persistence.file=/pushgateway/pushgateway.db
            - --persistence.interval=5m
          resources:
            limits:
              memory: "256Mi"
              cpu: "100m"
          volumeMounts:
            - name: pushgateway-storage
              mountPath: /pushgateway
      volumes:
        - name: pushgateway-storage
          persistentVolumeClaim:
            claimName: pushgateway-pvc

---
# 配置 Prometheus 抓取 Pushgateway
apiVersion: monitoring.coreos.com/v1
kind: ServiceMonitor
metadata:
  name: pushgateway
  namespace: ai-ide-monitoring
spec:
  selector:
    matchLabels:
      app: pushgateway
  endpoints:
    - port: web
      interval: 30s
      path: /metrics
  jobLabel: pushgateway
5. 追踪系统:OpenTelemetry 与 Trace 关联
本节为你提供的核心技术价值:理解分布式追踪的核心概念,掌握 OpenTelemetry 在 AI IDE 中的应用,实现跨服务请求追踪。
5.1 分布式追踪基础
在微服务架构中,一个用户请求可能涉及多个服务的协作。分布式追踪通过Trace ID 将请求路径串联起来:
Trace ID: abc123-def456-ghi789
│
├── Span 1: ai-ide-core (0ms - 150ms)
│   │
│   ├── Span 2: language-server (10ms - 50ms)
│   │   └── Span 4: semantic-analysis (15ms - 40ms)
│   │
│   └── Span 3: llm-integrator (60ms - 130ms)
│ └── Span 5: openai-api (70ms - 120ms)核心概念:
概念 | 说明 |
|---|---|
Trace | 一次请求的完整路径,所有 Span 的集合 |
Span | 一个操作单元,包含开始/结束时间、属性、事件 |
SpanContext | 跨进程传播的上下文(Trace ID、Span ID) |
Baggage | 随请求传递的键值对数据 |
Sampler | 采样策略,控制追踪数据量 |
5.2 OpenTelemetry 架构
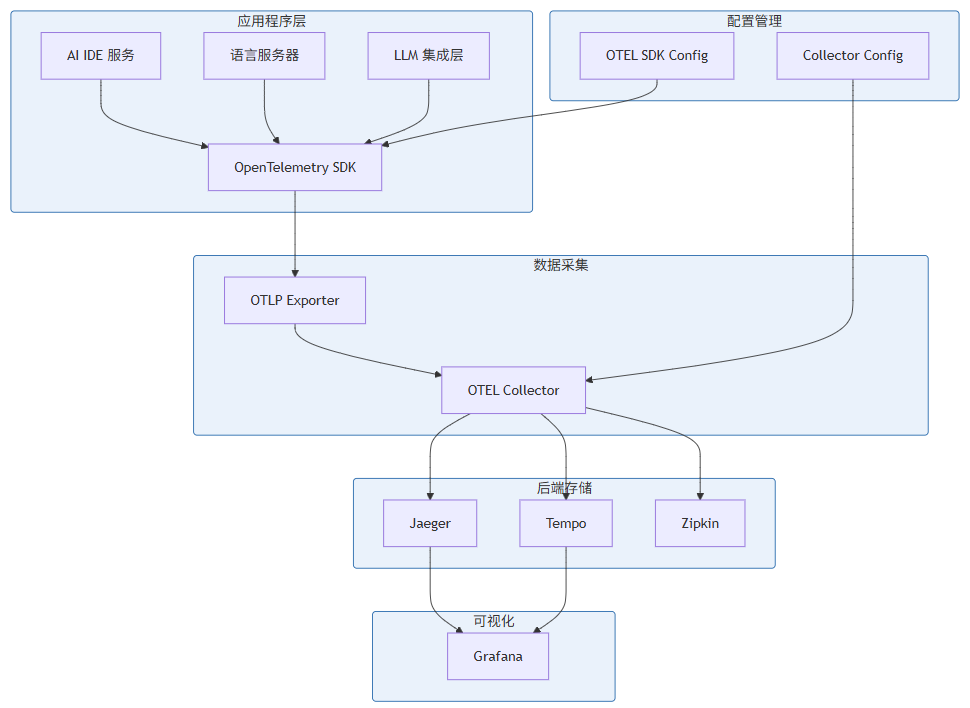
图 5-1:OpenTelemetry 追踪架构
5.3 AI IDE OpenTelemetry 实现
// src/observability/tracing.ts
import { NodeSDK } from '@opentelemetry/sdk-node';
import { getNodeAutoInstrumentations } from '@opentelemetry/auto-instrumentations-node';
import { OTLPTraceExporter } from '@opentelemetry/exporter-trace-otlp-http';
import { OTLPMetricExporter } from '@opentelemetry/exporter-metrics-otlp-http';
import { PeriodicExportingMetricReader } from '@opentelemetry/sdk-metrics';
import { Resource } from '@opentelemetry/resources';
import { SemanticResourceAttributes } from '@opentelemetry/semantic-conventions';
import {
  TraceContextPropagation,
  BatchSpanProcessor
} from '@opentelemetry/sdk-trace';
import {
  B3InjectEncoding,
  B3Propagator
} from '@opentelemetry/propagator-b3';
import { JaegerPropagator } from '@opentelemetry/propagator-jaeger';
import { ATTR_SERVICE_NAME, ATTR_SERVICE_VERSION } from '@opentelemetry/semantic-conventions';

// AI IDE 自定义资源属性
const aiIdeResource = new Resource({
  [ATTR_SERVICE_NAME]: 'ai-ide',
  [ATTR_SERVICE_VERSION]: process.env.VERSION || 'dev',
  'ai-ide.instance-id': process.env.INSTANCE_ID || require('os').hostname(),
  'ai-ide.environment': process.env.NODE_ENV || 'development',
});

// OTLP Exporter 配置
const otlpTraceExporter = new OTLPTraceExporter({
  url: process.env.OTEL_EXPORTER_OTLP_ENDPOINT || 'http://localhost:4318/v1/traces',
  headers: {
    'Authorization': `Bearer ${process.env.OTEL_EXPORTER_AUTH_TOKEN || ''}`
  },
});

// Metric Exporter 配置
const metricExporter = new OTLPMetricExporter({
  url: process.env.OTEL_EXPORTER_OTLP_ENDPOINT?.replace('/traces', '/metrics') ||
       'http://localhost:4318/v1/metrics',
});

const metricReader = new PeriodicExportingMetricReader({
  exporter: metricExporter,
  exportIntervalMillis: 10000,
  exportTimeoutMillis: 5000,
});

// 采样器配置
import {
  TraceIdRatioBasedSampler,
  ParentOrElseSampler,
  AlwaysOnSampler,
  AlwaysOffSampler
} from '@opentelemetry/sdk-trace';

const customSampler = new ParentOrElseSampler(
  new TraceIdRatioBasedSampler(0.1) // 10% 采样率
);

// SDK 配置
const sdk = new NodeSDK({
  resource: aiIdeResource,
  spanProcessor: new BatchSpanProcessor(otlpTraceExporter, {
    maxQueueSize: 2048,
    maxExportBatchSize: 512,
    scheduledDelayMillis: 5000,
    exportTimeoutMillis: 30000,
  }),
  instrumentations: [
    getNodeAutoInstrumentations({
      '@opentelemetry/instrumentation-fs': { enabled: false }, // 禁用文件系统追踪
      '@opentelemetry/instrumentation-http': { enabled: true },
      '@opentelemetry/instrumentation-express': { enabled: true },
      '@opentelemetry/instrumentation-ioredis': { enabled: true },
      '@opentelemetry/instrumentation-mongodb': { enabled: true },
    }),
  ],
  sampler: customSampler,
  textMapPropagator: new TraceContextPropagation({
    inject: [
      'traceparent',
      'tracestate',
      'b3',
      'jaeger',
    ],
  }),
});

// 初始化 SDK
sdk.start();

// Graceful Shutdown
process.on('SIGTERM', async () => {
  await sdk.shutdown()
    .then(() => console.log('OpenTelemetry SDK shut down successfully'))
    .catch((error) => console.error('Error shutting down OpenTelemetry SDK:', error));
});

export { sdk };
5.4 AI IDE 业务追踪封装
// src/observability/span-decorator.ts
import { trace, Span, SpanStatusCode, context, SpanKind } from '@opentelemetry/api';
import { AsyncLocalStorage } from 'async_hooks';

// 全局追踪器
const tracer = trace.getTracer('ai-ide', process.env.VERSION || 'dev');

// 追踪上下文存储
const trackingStorage = new AsyncLocalStorage<Map<string, any>>();

// 追踪装饰器工厂
export function traced<T extends (...args: any[]) => Promise<any>>(
  name: string,
  options: {
    kind?: SpanKind;
    attributes?: Record<string, string | number | boolean>;
    recordError?: boolean;
  } = {}
) {
  return function (
    target: any,
    propertyKey: string,
    descriptor: PropertyDescriptor
  ): PropertyDescriptor {
    const originalMethod = descriptor.value;

    descriptor.value = async function (...args: any[]): Promise<any> {
      const spanName = options.kind ? `${name} [${options.kind}]` : name;

      return tracer.startActiveSpan(
        spanName,
        {
          kind: options.kind || SpanKind.INTERNAL,
          attributes: {
            'ai-ide.operation': name,
            'ai-ide.method': propertyKey,
            ...options.attributes,
          },
        },
        async (span) => {
          const startTime = Date.now();

          try {
            const result = await originalMethod.apply(this, args);

            span.setStatus({ code: SpanStatusCode.OK });
            span.setAttribute('ai-ide.duration_ms', Date.now() - startTime);

            return result;
          } catch (error) {
            if (options.recordError !== false) {
              span.recordException(error as Error);
              span.setStatus({
                code: SpanStatusCode.ERROR,
                message: (error as Error).message,
              });
            }
            span.setAttribute('ai-ide.duration_ms', Date.now() - startTime);
            throw error;
          } finally {
            span.end();
          }
        }
      );
    };

    return descriptor;
  };
}

// LLM 请求追踪
export async function traceLLMRequest<T>(
  model: string,
  operation: string,
  handler: () => Promise<T>
): Promise<T> {
  return tracer.startActiveSpan(
    `LLM.${operation}`,
    {
      kind: SpanKind.CLIENT,
      attributes: {
        'ai-ide.llm.model': model,
        'ai-ide.llm.operation': operation,
        'ai-ide.llm.vendor': 'openai', // 可配置
      },
    },
    async (span) => {
      const startTime = Date.now();

      try {
        const result = await handler();

        // 如果结果包含 token 使用信息
        if (result && typeof result === 'object' && 'usage' in result) {
          const usage = (result as any).usage;
          span.setAttribute('ai-ide.llm.prompt_tokens', usage.prompt_tokens || 0);
          span.setAttribute('ai-ide.llm.completion_tokens', usage.completion_tokens || 0);
          span.setAttribute('ai-ide.llm.total_tokens', usage.total_tokens || 0);
        }

        span.setStatus({ code: SpanStatusCode.OK });
        span.setAttribute('ai-ide.llm.duration_ms', Date.now() - startTime);

        return result;
      } catch (error) {
        span.recordException(error as Error);
        span.setStatus({
          code: SpanStatusCode.ERROR,
          message: (error as Error).message,
        });
        span.setAttribute('ai-ide.llm.duration_ms', Date.now() - startTime);
        throw error;
      } finally {
        span.end();
      }
    }
  );
}

// LSP 请求追踪
export async function traceLSPRequest<T>(
  method: string,
  fileUri: string,
  handler: () => Promise<T>
): Promise<T> {
  return tracer.startActiveSpan(
    `LSP.${method}`,
    {
      kind: SpanKind.INTERNAL,
      attributes: {
        'ai-ide.lsp.method': method,
        'ai-ide.lsp.file_uri': fileUri,
      },
    },
    async (span) => {
      const startTime = Date.now();

      try {
        const result = await handler();
        span.setStatus({ code: SpanStatusCode.OK });
        span.setAttribute('ai-ide.lsp.duration_ms', Date.now() - startTime);
        return result;
      } catch (error) {
        span.recordException(error as Error);
        span.setStatus({
          code: SpanStatusCode.ERROR,
          message: (error as Error).message,
        });
        span.setAttribute('ai-ide.lsp.duration_ms', Date.now() - startTime);
        throw error;
      } finally {
        span.end();
      }
    }
  );
}

// 代码补全追踪
export async function traceCompletion<T>(
  triggerKind: string,
  context: { fileUri: string; position: { line: number; character: number } },
  handler: () => Promise<T>
): Promise<T> {
  return tracer.startActiveSpan(
    `Completion.${triggerKind}`,
    {
      kind: SpanKind.INTERNAL,
      attributes: {
        'ai-ide.completion.trigger_kind': triggerKind,
        'ai-ide.completion.file_uri': context.fileUri,
        'ai-ide.completion.line': context.position.line,
        'ai-ide.completion.character': context.position.character,
      },
    },
    async (span) => {
      const startTime = Date.now();

      try {
        const result = await handler();

        // 如果结果包含补全项数量
        if (result && typeof result === 'object' && 'items' in result) {
          span.setAttribute('ai-ide.completion.items_count', (result as any).items?.length || 0);
        }

        span.setStatus({ code: SpanStatusCode.OK });
        span.setAttribute('ai-ide.completion.duration_ms', Date.now() - startTime);

        return result;
      } catch (error) {
        span.recordException(error as Error);
        span.setStatus({
          code: SpanStatusCode.ERROR,
          message: (error as Error).message,
        });
        span.setAttribute('ai-ide.completion.duration_ms', Date.now() - startTime);
        throw error;
      } finally {
        span.end();
      }
    }
  );
}

// 添加追踪事件
export function addSpanEvent(name: string, attributes?: Record<string, string | number | boolean>): void {
  const currentSpan = trace.getActiveSpan();
  if (currentSpan) {
    currentSpan.addEvent(name, attributes);
  }
}

// 设置追踪属性
export function setSpanAttribute(key: string, value: string | number | boolean): void {
  const currentSpan = trace.getActiveSpan();
  if (currentSpan) {
    currentSpan.setAttribute(key, value);
  }
}

// 获取当前追踪上下文
export function getCurrentTraceContext(): { traceId: string; spanId: string } | null {
  const currentSpan = trace.getActiveSpan();
  if (currentSpan) {
    const spanContext = currentSpan.spanContext();
    return {
      traceId: spanContext.traceId,
      spanId: spanContext.spanId,
    };
  }
  return null;
}
5.5 OpenTelemetry Collector 配置
# otel-collector-config.yaml
receivers:
  # OTLP 协议接收(gRPC + HTTP)
  otlp:
    protocols:
      grpc:
        endpoint: 0.0.0.0:4317
      http:
        endpoint: 0.0.0.0:4318

  # Prometheus 指标抓取
  prometheus:
    config:
      scrape_configs:
        - job_name: 'ai-ide-services'
          static_configs:
            - targets: ['ai-ide-core:9090', 'ai-ide-llm:9090', 'ai-ide-lsp:9090']

  # Jaeger 兼容接收
  jaeger:
    protocols:
      thrift_http:
        endpoint: 0.0.0.0:14268
      thrift_binary:
        endpoint: 0.0.0.0:6832

processors:
  # 批量处理
  batch:
    timeout: 5s
    send_batch_size: 1024
    send_batch_max_size: 2048

  # 内存限制
  memory_limiter:
    check_interval: 1s
    limit_mib: 512
    spike_limit_mib: 128

  # 属性过滤
  filter:
    traces:
      exclude:
        match_type: strict
        resource_attributes:
          - key: ai-ide.internal
            value: "true"

  # 属性增强
  resource:
    attributes:
      - action: upsert
        key: deployment.environment
        value: ${DEPLOYMENT_ENV:production}
      - action: upsert
        key: cloud.region
        value: ${CLOUD_REGION:us-east-1}

  # Trace ID 重新生成(用于隐私保护)
  transform:
    trace_statements:
      - context: span
        statements:
          - replace_pattern(attributes["user.id"], "^(.{4}).*(.{4})$", "$1****$2")

  # 尾采样
  tail_sampling:
    decision_wait: 10s
    num_traces: 100000
    expected_new_traces_per_sec: 1000
    policies:
      - name: errors-policy
        type: status_code
        status_code: {status_codes: [ERROR]}

      - name: slow-traces-policy
        type: latency
        latency: {threshold_ms: 1000}

      - name: probabilistic-policy
        type: probabilistic
        probabilistic: {sampling_percentage: 10}

      - name: llm-traces-policy
        type: attribute
        attribute: {key: ai-ide.llm.operation, value: inference, action: include}

exporters:
  # 导出到 Jaeger
  jaeger:
    endpoint: jaeger:14250
    tls:
      insecure: true

  # 导出到 Tempo (Grafana Cloud)
  otlp/tempo:
    endpoint: ${TEMPO_ENDPOINT}
    headers:
      Authorization: ${TEMPO_AUTH_HEADER}

  # 导出到 Prometheus Remote Write
  prometheusremotewrite:
    endpoint: ${PROMETHEUS_REMOTE_WRITE_ENDPOINT}
    external_labels:
      cluster: ai-ide
      environment: ${DEPLOYMENT_ENV:production}

  # 导出到 Elasticsearch(用于日志关联)
  otlp/elasticsearch:
    endpoint: ${ELASTICSEARCH_ENDPOINT}
    headers:
      Authorization: ${ELASTICSEARCH_AUTH_HEADER}
    tls:
      insecure: false

  # 调试导出
  logging:
    verbosity: detailed

service:
  pipelines:
    traces:
      receivers: [otlp, jaeger]
      processors: [memory_limiter, filter, batch, resource, transform, tail_sampling]
      exporters: [jaeger, otlp/tempo, logging]

    metrics:
      receivers: [prometheus, otlp]
      processors: [memory_limiter, batch, resource]
      exporters: [prometheusremotewrite, otlp/elasticsearch, logging]

  telemetry:
    metrics:
      address: 0.0.0.0:8888
    logs:
      level: info
6. 告警系统:阈值告警、趋势告警、智能告警
本节为你提供的核心技术价值:建立多层次的告警体系,从简单的阈值告警到智能异常检测,实现问题的早发现、早处理。
6.1 告警分层架构
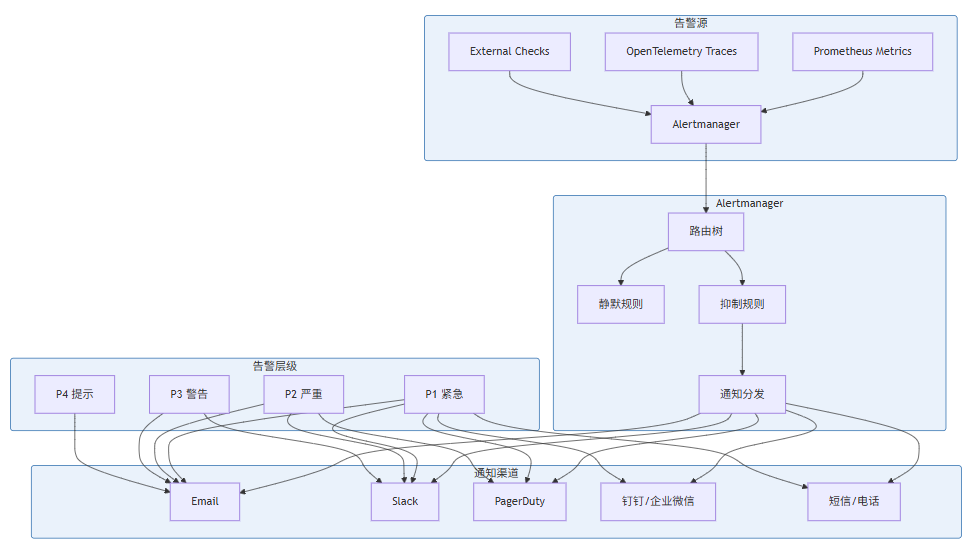
图 6-1:告警系统架构
6.2 告警级别定义
级别 | 名称 | 定义 | 响应时间 | 通知方式 |
|---|---|---|---|---|
P1 | 紧急 | 服务不可用、数据丢失风险 | < 5 分钟 | 全渠道 + 电话 |
P2 | 严重 | 功能受损、影响核心业务 | < 15 分钟 | Slack + Email + PagerDuty |
P3 | 警告 | 性能下降、潜在风险 | < 1 小时 | Slack + Email |
P4 | 提示 | 需要关注但不紧急 | 下一个工作日 |
6.3 Prometheus 告警规则
# rules/ai-ide-alerts.yml
groups:
  - name: ai-ide-llm-alerts
    interval: 30s
    rules:
      # P1: LLM 服务完全不可用
      - alert: LLMServiceDown
        expr: up{job="ai-ide-llm"} == 0
        for: 1m
        labels:
          severity: critical
          team: ai-platform
        annotations:
          summary: "LLM 服务实例不可用"
          description: "LLM 服务 {{ $labels.instance }} 已经停止运行超过 1 分钟"
          runbook_url: "https://wiki.ai-ide.com/runbooks/llm-down"

      # P2: LLM 请求错误率过高
      - alert: LLMHighErrorRate
        expr: |
          (
            rate(ai_ide_llm_requests_total{status="error"}[5m]) /
            rate(ai_ide_llm_requests_total[5m])
          ) > 0.05
        for: 5m
        labels:
          severity: warning
          team: ai-platform
        annotations:
          summary: "LLM 请求错误率超过 5%"
          description: "LLM 请求 5 分钟错误率为 {{ $value | humanizePercentage }}"
          runbook_url: "https://wiki.ai-ide.com/runbooks/llm-errors"

      # P1: LLM 延迟过高
      - alert: LLMLatencyCritical
        expr: |
          histogram_quantile(0.99,
            rate(ai_ide_llm_request_duration_seconds_bucket[5m])
          ) > 30
        for: 3m
        labels:
          severity: critical
          team: ai-platform
        annotations:
          summary: "LLM P99 延迟超过 30 秒"
          description: "LLM 推理 P99 延迟为 {{ $value | humanizeDuration }}"
          runbook_url: "https://wiki.ai-ide.com/runbooks/llm-latency"

      # P2: LLM Token 配额预警
      - alert: LLMTokenQuotaWarning
        expr: |
          (
            ai_ide_llm_token_usage /
            (ai_ide_llm_token_usage + (ai_ide_llm_token_remaining > 0 ? ai_ide_llm_token_remaining : 1))
          ) > 0.8
        for: 10m
        labels:
          severity: warning
          team: ai-platform
        annotations:
          summary: "LLM Token 配额使用超过 80%"
          description: "模型 {{ $labels.model }} Token 配额使用率为 {{ $value | humanizePercentage }}"

      # P3: LLM 请求量异常(可能遭受滥用)
      - alert: LLMRequestRateAnomaly
        expr: |
          (
            rate(ai_ide_llm_requests_total[10m]) /
            rate(ai_ide_llm_requests_total[10m] offset 1h)
          ) > 3
        for: 15m
        labels:
          severity: warning
          team: security
        annotations:
          summary: "LLM 请求量突增 3 倍以上"
          description: "过去 10 分钟请求量是 1 小时前的 {{ $value | humanize }} 倍"

  - name: ai-ide-lsp-alerts
    interval: 30s
    rules:
      # P2: 语言服务器响应缓慢
      - alert: LSPSlowResponse
        expr: |
          histogram_quantile(0.95,
            rate(ai_ide_lsp_request_duration_seconds_bucket{method=~"textDocument/.*"}[5m])
          ) > 5
        for: 5m
        labels:
          severity: warning
          team: core
        annotations:
          summary: "LSP 服务响应缓慢"
          description: "{{ $labels.method }} P95 延迟超过 5 秒,当前为 {{ $value | humanizeDuration }}"

      # P3: LSP 诊断数量异常
      - alert: LSPHighDiagnosticCount
        expr: |
          avg(ai_ide_lsp_diagnostics_count) by (instance) > 1000
        for: 10m
        labels:
          severity: warning
          team: core
        annotations:
          summary: "LSP 诊断数量过多"
          description: "实例 {{ $labels.instance }} 平均诊断数量为 {{ $value }}"

  - name: ai-ide-infrastructure-alerts
    interval: 15s
    rules:
      # P1: 内存使用率过高
      - alert: HighMemoryUsage
        expr: |
          (
            1 - node_memory_MemAvailable_bytes / node_memory_MemTotal_bytes
          ) > 0.9
        for: 5m
        labels:
          severity: critical
          team: infrastructure
        annotations:
          summary: "内存使用率超过 90%"
          description: "主机 {{ $labels.instance }} 内存使用率为 {{ $value | humanizePercentage }}"

      # P2: CPU 使用率持续高位
      - alert: HighCPUUsage
        expr: |
          100 - (avg by (instance) (rate(node_cpu_seconds_total{mode="idle"}[5m])) * 100) > 80
        for: 10m
        labels:
          severity: warning
          team: infrastructure
        annotations:
          summary: "CPU 使用率超过 80%"
          description: "主机 {{ $labels.instance }} CPU 使用率为 {{ $value | humanizePercentage }}"

      # P2: 磁盘空间不足
      - alert: LowDiskSpace
        expr: |
          (node_filesystem_avail_bytes{mountpoint="/"} / node_filesystem_size_bytes{mountpoint="/"}) < 0.1
        for: 5m
        labels:
          severity: warning
          team: infrastructure
        annotations:
          summary: "磁盘空间不足"
          description: "主机 {{ $labels.instance }} 根分区可用空间低于 10%"

      # P1: Kubernetes Pod 重启频繁
      - alert: PodRestartingFrequently
        expr: |
          increase(kube_pod_container_status_restarts_total[1h]) > 5
        for: 0m
        labels:
          severity: warning
          team: infrastructure
        annotations:
          summary: "Pod 重启次数过多"
          description: "Pod {{ $labels.namespace }}/{{ $labels.pod }} 过去 1 小时重启 {{ $value }} 次"

  - name: ai-ide-slo-alerts
    interval: 1m
    rules:
      # P2: SLO 告警 - 可用性
      - alert: SLOServiceAvailability
        expr: |
          (
            1 - (
              sum(rate(ai_ide_llm_requests_total{status=~"error|timeout"}[1h])) /
              sum(rate(ai_ide_llm_requests_total[1h]))
            )
          ) < 0.995
        for: 30m
        labels:
          severity: warning
          team: platform
        annotations:
          summary: "SLO 告警:可用性低于 99.5%"
          description: "过去 1 小时可用性为 {{ $value | humanizePercentage }}"

      # P3: SLO 告警 - 延迟
      - alert: SLOLatency
        expr: |
          histogram_quantile(0.99,
            rate(ai_ide_llm_request_duration_seconds_bucket[1h])
          ) > 10
        for: 1h
        labels:
          severity: warning
          team: platform
        annotations:
          summary: "SLO 告警:P99 延迟高于 10 秒"
          description: "过去 1 小时 P99 延迟为 {{ $value | humanizeDuration }}"
6.4 Alertmanager 配置
# alertmanager.yml
global:
  resolve_timeout: 5m
  smtp_smarthost: 'smtp.gmail.com:587'
  smtp_from: 'ai-ide-alerts@example.com'
  smtp_auth_username: 'alerts@example.com'
  smtp_auth_password: '${SMTP_PASSWORD}'

templates:
  - '/etc/alertmanager/templates/*.tmpl'

route:
  group_by: ['alertname', 'cluster', 'service']
  group_wait: 30s
  group_interval: 5m
  repeat_interval: 4h
  receiver: 'default-receiver'
  routes:
    # P1 紧急告警 - 立即通知
    - match:
        severity: critical
      receiver: 'critical-receiver'
      group_wait: 0s
      repeat_interval: 1h

    # LLM 相关告警 - 发给 AI 平台团队
    - match:
        team: ai-platform
      receiver: 'ai-platform-receiver'
      routes:
        - match:
            severity: critical
          receiver: 'ai-platform-critical'

    # 基础设施告警 - 发给运维团队
    - match:
        team: infrastructure
      receiver: 'infrastructure-receiver'

    # 安全相关告警 - 发给安全团队
    - match:
        team: security
      receiver: 'security-receiver'

receivers:
  - name: 'default-receiver'
    email_configs:
      - to: 'team@example.com'
        headers:
          subject: '【提示】{{ .GroupLabels.alertname }}'
        send_resolved: true

  - name: 'critical-receiver'
    slack_configs:
      - channel: '#ai-ide-critical'
        send_resolved: true
        title: '🚨 {{ .GroupLabels.alertname }}'
        text: |
          {{ range .Alerts }}
          *告警:* {{ .Annotations.summary }}
          *描述:* {{ .Annotations.description }}
          *级别:* {{ .Labels.severity }}
          *时间:* {{ .StartsAt }}
          {{ if .Annotations.runbook_url }}
          *Runbook:* {{ .Annotations.runbook_url }}
          {{ end }}
          {{ end }}
    pagerduty_configs:
      - service_key: '${PAGERDUTY_SERVICE_KEY}'
        severity: critical
        send_resolved: true

  - name: 'ai-platform-receiver'
    slack_configs:
      - channel: '#ai-platform'
        send_resolved: true

  - name: 'ai-platform-critical'
    slack_configs:
      - channel: '#ai-platform-critical'
        send_resolved: true
    pagerduty_configs:
      - service_key: '${PAGERDUTY_AI_PLATFORM_KEY}'

  - name: 'infrastructure-receiver'
    slack_configs:
      - channel: '#infrastructure'
        send_resolved: true

  - name: 'security-receiver'
    slack_configs:
      - channel: '#security'
        send_resolved: true
    email_configs:
      - to: 'security@example.com'
        send_resolved: true

# 抑制规则:Kubernetes Node 宕机时,抑制该节点上所有 Pod 告警
inhibit_rules:
  - source_match:
      alertname: 'KubeNodeDown'
    target_match:
      alertname: '^KubePodDown$'
    equal: ['node']

  - source_match:
      alertname: 'HighMemoryUsage'
    target_match:
      alertname: '.*'
    equal: ['instance']

  # 同一服务的高级别告警抑制低级别告警
  - source_match:
      severity: critical
    target_match:
      severity: warning
    equal: ['service', 'team']
6.5 趋势告警与智能告警
传统的阈值告警存在误报和漏报问题。趋势告警和智能告警可以更好地捕捉异常:
# src/observability/trend_alerting.py
import numpy as np
from dataclasses import dataclass
from typing import List, Optional, Callable
from datetime import datetime, timedelta
import logging

logger = logging.getLogger(__name__)

@dataclass
class TrendPoint:
    timestamp: datetime
    value: float

class TrendDetector:
    """基于统计的趋势异常检测器"""

    def __init__(
        self,
        window_size: int = 60,  # 窗口大小(数据点数)
        z_threshold: float = 3.0,  # Z-score 阈值
        min_trend_samples: int = 10
    ):
        self.window_size = window_size
        self.z_threshold = z_threshold
        self.min_trend_samples = min_trend_samples
        self.history: List[TrendPoint] = []

    def add_sample(self, value: float, timestamp: Optional[datetime] = None) -> bool:
        """
        添加样本并返回是否检测到异常
        """
        if timestamp is None:
            timestamp = datetime.now()

        self.history.append(TrendPoint(timestamp, value))

        # 保持窗口大小
        if len(self.history) > self.window_size:
            self.history.pop(0)

        # 需要足够的数据
        if len(self.history) < self.min_trend_samples:
            return False

        return self._detect_anomaly(value)

    def _detect_anomaly(self, current_value: float) -> bool:
        """使用 Z-score 检测异常"""
        values = np.array([p.value for p in self.history])

        mean = np.mean(values)
        std = np.std(values)

        if std == 0:
            return False

        z_score = abs(current_value - mean) / std

        return z_score > self.z_threshold

    def get_trend(self) -> str:
        """获取当前趋势"""
        if len(self.history) < 2:
            return "unknown"

        recent = np.array([p.value for p in self.history[-10:]])
        older = np.array([p.value for p in self.history[-20:-10]]) if len(self.history) >= 20 else recent

        if np.mean(recent) > np.mean(older) * 1.2:
            return "increasing"
        elif np.mean(recent) < np.mean(older) * 0.8:
            return "decreasing"
        return "stable"


class SeasonalTrendDetector:
    """基于季节性分解的趋势检测"""

    def __init__(
        self,
        period: int = 1440,  # 日周期(分钟)
        lookback_periods: int = 3,
        deviation_threshold: float = 2.0
    ):
        self.period = period
        self.lookback_periods = lookback_periods
        self.deviation_threshold = deviation_threshold
        self.history: List[TrendPoint] = []

    def add_sample(self, value: float, timestamp: Optional[datetime] = None) -> bool:
        """检测季节性异常"""
        if timestamp is None:
            timestamp = datetime.now()

        self.history.append(TrendPoint(timestamp, value))

        # 需要至少一个完整周期
        if len(self.history) < self.period:
            return False

        # 获取历史同期数据
        current_idx = len(self.history) - 1
        historical_values = []

        for i in range(1, self.lookback_periods + 1):
            idx = current_idx - (i * self.period)
            if idx >= 0:
                historical_values.append(self.history[idx].value)

        if len(historical_values) < self.lookback_periods:
            return False

        # 计算历史均值和标准差
        historical_mean = np.mean(historical_values)
        historical_std = np.std(historical_values)

        if historical_std == 0:
            return False

        # 检测是否偏离历史同期
        deviation = abs(value - historical_mean) / historical_std

        return deviation > self.deviation_threshold

    def predict_next(self) -> float:
        """预测下一个值(基于季节性)"""
        if len(self.history) < self.period:
            return np.mean([p.value for p in self.history])

        # 使用最近一个周期的对应点
        return self.history[-1].value


class AdaptiveThresholdDetector:
    """自适应阈值检测器"""

    def __init__(
        self,
        initial_threshold: float,
        adjustment_factor: float = 0.1,
        cooldown_periods: int = 5
    ):
        self.base_threshold = initial_threshold
        self.current_threshold = initial_threshold
        self.adjustment_factor = adjustment_factor
        self.cooldown_periods = cooldown_periods
        self.periods_since_adjustment = 0
        self.false_positive_count = 0

    def check(
        self,
        value: float,
        is_true_positive: Optional[Callable[[], bool]] = None
    ) -> bool:
        """
        检查是否超过阈值

        Args:
            value: 当前值
            is_true_positive: 可选的回调,用于判断告警是否为真阳性
        """
        exceeded = value > self.current_threshold
        self.periods_since_adjustment += 1

        # 模拟反馈:如果提供回调,记录是否误报
        # 实际实现中,这需要从告警反馈系统获取
        if exceeded and is_true_positive is not None:
            if not is_true_positive():
                self.false_positive_count += 1

                # 如果误报率过高,降低阈值
                if self.false_positive_count >= 3:
                    self.current_threshold *= (1 + self.adjustment_factor)
                    self.false_positive_count = 0
                    self.periods_since_adjustment = 0
                    logger.info(f"Adjusted threshold up to {self.current_threshold}")

        return exceeded

    def report_true_positive(self):
        """报告真阳性"""
        if self.periods_since_adjustment >= self.cooldown_periods:
            # 正常情况下,逐步提高阈值(适应正常波动)
            self.current_threshold *= (1 - self.adjustment_factor * 0.5)
            self.current_threshold = max(
                self.current_threshold,
                self.base_threshold * 0.8
            )
            self.periods_since_adjustment = 0
            logger.info(f"Adjusted threshold down to {self.current_threshold}")


# 使用示例
class MetricsAlertEngine:
    """指标告警引擎"""

    def __init__(self):
        # 错误率检测
        self.error_rate_detector = TrendDetector(
            window_size=60,
            z_threshold=2.5
        )

        # 延迟检测(季节性)
        self.latency_detector = SeasonalTrendDetector(
            period=1440,  # 每日周期
            deviation_threshold=2.0
        )

        # Token 使用检测
        self.token_detector = AdaptiveThresholdDetector(
            initial_threshold=1000000,
            adjustment_factor=0.1
        )

    def check_error_rate(self, error_rate: float) -> Optional[dict]:
        """检查错误率"""
        if self.error_rate_detector.add_sample(error_rate):
            trend = self.error_rate_detector.get_trend()
            return {
                'alert_type': 'error_rate_anomaly',
                'value': error_rate,
                'trend': trend,
                'severity': 'warning'
            }
        return None

    def check_latency(self, latency: float, timestamp: datetime) -> Optional[dict]:
        """检查延迟"""
        if self.latency_detector.add_sample(latency, timestamp):
            predicted = self.latency_detector.predict_next()
            deviation = (latency - predicted) / predicted if predicted > 0 else 0
            return {
                'alert_type': 'latency_seasonal_anomaly',
                'value': latency,
                'predicted': predicted,
                'deviation': deviation,
                'severity': 'warning'
            }
        return None

    def check_token_usage(self, token_count: int) -> Optional[dict]:
        """检查 Token 使用"""
        if self.token_detector.check(token_count):
            return {
                'alert_type': 'token_quota_warning',
                'value': token_count,
                'threshold': self.token_detector.current_threshold,
                'severity': 'warning'
            }
        return None
7. 实践:构建 AI IDE 的可观测性仪表盘
本节为你提供的核心技术价值:通过实际案例展示如何构建 AI IDE 的可观测性仪表盘,实现多维度数据的统一可视化。
7.1 Grafana Dashboard 设计原则
有效的监控仪表盘应遵循以下原则:
原则 | 说明 | 实现方法 |
|---|---|---|
分层展示 | 从全局到局部 | 顶部概览 → 中间详情 → 底部原始数据 |
信息密度 | 平衡信息量与可读性 | 使用网格布局,避免拥挤 |
颜色编码 | 统一的颜色语义 | 绿色=正常,黄色=警告,红色=严重 |
交互性 | 支持下钻和筛选 | 使用变量、模板 |
性能优先 | 减少查询负载 | 使用预聚合、Recording Rules |
7.2 AI IDE 综合仪表盘
{
  "annotations": {
    "list": [
      {
        "builtIn": 1,
        "datasource": "-- Grafana --",
        "enable": true,
        "hide": true,
        "iconColor": "rgba(0, 211, 255, 1)",
        "name": "Annotations & Alerts",
        "type": "dashboard"
      }
    ]
  },
  "editable": true,
  "gnetId": null,
  "graphTooltip": 1,
  "id": null,
  "iteration": 1704067200000,
  "links": [],
  "panels": [
    {
      "collapsed": false,
      "gridPos": {
        "h": 1,
        "w": 24,
        "x": 0,
        "y": 0
      },
      "id": 1,
      "panels": [],
      "title": "概览 (SLO Summary)",
      "type": "row"
    },
    {
      "datasource": "Prometheus",
      "fieldConfig": {
        "defaults": {
          "color": {
            "mode": "thresholds"
          },
          "mappings": [],
          "thresholds": {
            "mode": "absolute",
            "steps": [
              { "color": "green", "value": null },
              { "color": "yellow", "value": 99.5 },
              { "color": "red", "value": 99 }
            ]
          },
          "unit": "percent"
        }
      },
      "gridPos": { "h": 4, "w": 6, "x": 0, "y": 1 },
      "id": 2,
      "options": {
        "colorMode": "value",
        "graphMode": "area",
        "justifyMode": "auto",
        "orientation": "auto",
        "reduceOptions": {
          "calcs": ["lastNotNull"],
          "fields": "",
          "values": false
        },
        "textMode": "auto"
      },
      "pluginVersion": "9.5.0",
      "targets": [
        {
          "expr": "(1 - (sum(rate(ai_ide_llm_requests_total{status=~'error|timeout'}[1h])) / sum(rate(ai_ide_llm_requests_total[1h])))) * 100",
          "legendFormat": "可用性",
          "refId": "A"
        }
      ],
      "title": "服务可用性 (30d SLO)",
      "type": "stat"
    },
    {
      "datasource": "Prometheus",
      "fieldConfig": {
        "defaults": {
          "color": { "mode": "palette-classic" },
          "mappings": [],
          "thresholds": {
            "mode": "absolute",
            "steps": [
              { "color": "green", "value": null },
              { "color": "yellow", "value": 5 },
              { "color": "red", "value": 10 }
            ]
          },
          "unit": "s"
        }
      },
      "gridPos": { "h": 4, "w": 6, "x": 6, "y": 1 },
      "id": 3,
      "options": {
        "colorMode": "value",
        "graphMode": "area",
        "justifyMode": "auto",
        "orientation": "auto",
        "reduceOptions": {
          "calcs": ["lastNotNull"],
          "fields": "",
          "values": false
        },
        "textMode": "auto"
      },
      "targets": [
        {
          "expr": "histogram_quantile(0.99, sum(rate(ai_ide_llm_request_duration_seconds_bucket[5m])) by (le))",
          "legendFormat": "P99",
          "refId": "A"
        },
        {
          "expr": "histogram_quantile(0.95, sum(rate(ai_ide_llm_request_duration_seconds_bucket[5m])) by (le))",
          "legendFormat": "P95",
          "refId": "B"
        }
      ],
      "title": "LLM 响应延迟",
      "type": "stat"
    },
    {
      "datasource": "Prometheus",
      "fieldConfig": {
        "defaults": {
          "color": { "mode": "thresholds" },
          "mappings": [],
          "thresholds": {
            "mode": "absolute",
            "steps": [
              { "color": "green", "value": null },
              { "color": "yellow", "value": 5 },
              { "color": "red", "value": 10 }
            ]
          },
          "unit": "percentunit"
        }
      },
      "gridPos": { "h": 4, "w": 6, "x": 12, "y": 1 },
      "id": 4,
      "targets": [
        {
          "expr": "sum(rate(ai_ide_llm_requests_total{status='error'}[5m])) / sum(rate(ai_ide_llm_requests_total[5m]))",
          "legendFormat": "错误率",
          "refId": "A"
        }
      ],
      "title": "LLM 错误率",
      "type": "stat"
    },
    {
      "datasource": "Prometheus",
      "fieldConfig": {
        "defaults": {
          "color": { "mode": "thresholds" },
          "mappings": [],
          "thresholds": {
            "mode": "absolute",
            "steps": [
              { "color": "green", "value": null },
              { "color": "yellow", "value": 50000000 },
              { "color": "red", "value": 80000000 }
            ]
          },
          "unit": "short"
        }
      },
      "gridPos": { "h": 4, "w": 6, "x": 18, "y": 1 },
      "id": 5,
      "targets": [
        {
          "expr": "sum(increase(ai_ide_llm_tokens_total[24h]))",
          "legendFormat": "Token 使用",
          "refId": "A"
        }
      ],
      "title": "Token 消耗 (24h)",
      "type": "stat"
    },
    {
      "collapsed": false,
      "gridPos": { "h": 1, "w": 24, "x": 0, "y": 5 },
      "id": 10,
      "title": "LLM 性能详情",
      "type": "row"
    },
    {
      "datasource": "Prometheus",
      "fieldConfig": {
        "defaults": {
          "color": { "mode": "palette-classic" },
          "custom": {
            "axisCenteredZero": false,
            "axisColorMode": "text",
            "axisLabel": "",
            "axisPlacement": "auto",
            "barAlignment": 0,
            "drawStyle": "line",
            "fillOpacity": 10,
            "gradientMode": "none",
            "hideFrom": { "legend": false, "tooltip": false, "viz": false },
            "lineInterpolation": "smooth",
            "lineWidth": 2,
            "pointSize": 5,
            "scaleDistribution": { "type": "linear" },
            "showPoints": "never",
            "spanNulls": true,
            "stacking": { "group": "A", "mode": "none" },
            "thresholdsStyle": { "mode": "off" }
          },
          "mappings": [],
          "thresholds": {
            "mode": "absolute",
            "steps": [{ "color": "green", "value": null }]
          },
          "unit": "reqps"
        }
      },
      "gridPos": { "h": 8, "w": 12, "x": 0, "y": 6 },
      "id": 11,
      "options": {
        "legend": { "calcs": ["mean", "max"], "displayMode": "table", "placement": "bottom" },
        "tooltip": { "mode": "multi", "sort": "desc" }
      },
      "targets": [
        {
          "expr": "sum(rate(ai_ide_llm_requests_total[5m])) by (model)",
          "legendFormat": "{{ model }}",
          "refId": "A"
        }
      ],
      "title": "LLM 请求速率 (按模型)",
      "type": "timeseries"
    },
    {
      "datasource": "Prometheus",
      "fieldConfig": {
        "defaults": {
          "color": { "mode": "palette-classic" },
          "custom": {
            "axisCenteredZero": false,
            "axisColorMode": "text",
            "axisLabel": "",
            "axisPlacement": "auto",
            "barAlignment": 0,
            "drawStyle": "line",
            "fillOpacity": 10,
            "gradientMode": "none",
            "hideFrom": { "legend": false, "tooltip": false, "viz": false },
            "lineInterpolation": "smooth",
            "lineWidth": 2,
            "pointSize": 5,
            "scaleDistribution": { "type": "linear" },
            "showPoints": "never",
            "spanNulls": true,
            "stacking": { "group": "A", "mode": "none" },
            "thresholdsStyle": { "mode": "off" }
          },
          "mappings": [],
          "thresholds": {
            "mode": "absolute",
            "steps": [{ "color": "green", "value": null }]
          },
          "unit": "s"
        }
      },
      "gridPos": { "h": 8, "w": 12, "x": 12, "y": 6 },
      "id": 12,
      "options": {
        "legend": { "calcs": ["mean", "max"], "displayMode": "table", "placement": "bottom" },
        "tooltip": { "mode": "multi", "sort": "desc" }
      },
      "targets": [
        {
          "expr": "histogram_quantile(0.99, sum(rate(ai_ide_llm_request_duration_seconds_bucket[5m])) by (le, model))",
          "legendFormat": "P99 - {{ model }}",
          "refId": "A"
        },
        {
          "expr": "histogram_quantile(0.95, sum(rate(ai_ide_llm_request_duration_seconds_bucket[5m])) by (le, model))",
          "legendFormat": "P95 - {{ model }}",
          "refId": "B"
        }
      ],
      "title": "LLM 延迟分布 (按模型)",
      "type": "timeseries"
    },
    {
      "datasource": "Prometheus",
      "fieldConfig": {
        "defaults": {
          "color": { "mode": "palette-classic" },
          "custom": {
            "axisCenteredZero": false,
            "axisColorMode": "text",
            "axisLabel": "",
            "axisPlacement": "auto",
            "fillOpacity": 80,
            "gradientMode": "none",
            "hideFrom": { "legend": false, "tooltip": false, "viz": false },
            "lineWidth": 1,
            "scaleDistribution": { "type": "linear" }
          },
          "mappings": [],
          "thresholds": {
            "mode": "absolute",
            "steps": [{ "color": "green", "value": null }]
          },
          "unit": "short"
        }
      },
      "gridPos": { "h": 8, "w": 8, "x": 0, "y": 14 },
      "id": 13,
      "options": {
        "barRadius": 0,
        "barWidth": 0.8,
        "fullHighlight": false,
        "groupWidth": 0.7,
        "legend": { "displayMode": "list", "placement": "bottom" },
        "orientation": "auto",
        "showValue": "auto",
        "stacking": "none",
        "tooltip": { "mode": "single", "sort": "none" },
        "xTickLabelRotation": 0,
        "xTickLabelSpacing": 0
      },
      "targets": [
        {
          "expr": "sum(increase(ai_ide_llm_tokens_total[24h])) by (type)",
          "legendFormat": "{{ type }}",
          "refId": "A"
        }
      ],
      "title": "Token 消耗分布 (24h)",
      "type": "barchart"
    },
    {
      "datasource": "Prometheus",
      "fieldConfig": {
        "defaults": {
          "color": { "mode": "palette-classic" },
          "custom": {
            "fillOpacity": 80,
            "gradientMode": "none",
            "hideFrom": { "legend": false, "tooltip": false, "viz": false },
            "lineWidth": 1
          },
          "mappings": [],
          "thresholds": {
            "mode": "absolute",
            "steps": [{ "color": "green", "value": null }]
          },
          "unit": "short"
        }
      },
      "gridPos": { "h": 8, "w": 8, "x": 8, "y": 14 },
      "id": 14,
      "options": {
        "displayLabels": ["name", "value"],
        "legend": { "displayMode": "table", "placement": "right" },
        "pieType": "pie",
        "reduceOptions": { "calcs": ["lastNotNull"], "fields": "", "values": false },
        "tooltip": { "mode": "single", "sort": "none" }
      },
      "targets": [
        {
          "expr": "sum by (status) (increase(ai_ide_llm_requests_total[24h]))",
          "legendFormat": "{{ status }}",
          "refId": "A"
        }
      ],
      "title": "LLM 请求状态分布 (24h)",
      "type": "piechart"
    },
    {
      "datasource": "Prometheus",
      "fieldConfig": {
        "defaults": {
          "color": { "mode": "palette-classic" },
          "custom": {
            "axisCenteredZero": false,
            "axisColorMode": "text",
            "axisLabel": "",
            "axisPlacement": "auto",
            "barAlignment": 0,
            "drawStyle": "line",
            "fillOpacity": 10,
            "gradientMode": "none",
            "hideFrom": { "legend": false, "tooltip": false, "viz": false },
            "lineInterpolation": "smooth",
            "lineWidth": 2,
            "pointSize": 5,
            "scaleDistribution": { "type": "linear" },
            "showPoints": "never",
            "spanNulls": true,
            "stacking": { "group": "A", "mode": "none" },
            "thresholdsStyle": { "mode": "off" }
          },
          "mappings": [],
          "thresholds": {
            "mode": "absolute",
            "steps": [{ "color": "green", "value": null }]
          },
          "unit": "short"
        }
      },
      "gridPos": { "h": 8, "w": 8, "x": 16, "y": 14 },
      "id": 15,
      "options": {
        "legend": { "calcs": [], "displayMode": "list", "placement": "bottom" },
        "tooltip": { "mode": "multi", "sort": "desc" }
      },
      "targets": [
        {
          "expr": "ai_ide_llm_token_usage",
          "legendFormat": "{{ model }} - {{ quota_type }}",
          "refId": "A"
        }
      ],
      "title": "Token 配额使用",
      "type": "timeseries"
    }
  ],
  "refresh": "30s",
  "schemaVersion": 38,
  "style": "dark",
  "tags": ["ai-ide", "observability", "llm"],
  "templating": {
    "list": [
      {
        "current": { "selected": false, "text": "all", "value": "$__all" },
        "datasource": "Prometheus",
        "definition": "label_values(ai_ide_llm_requests_total, model)",
        "hide": 0,
        "includeAll": true,
        "label": "模型",
        "multi": true,
        "name": "model",
        "options": [],
        "query": "label_values(ai_ide_llm_requests_total, model)",
        "refresh": 2,
        "regex": "",
        "skipUrlSync": false,
        "sort": 1,
        "type": "query"
      },
      {
        "current": { "selected": false, "text": "all", "value": "$__all" },
        "datasource": "Prometheus",
        "definition": "label_values(ai_ide_llm_requests_total, environment)",
        "hide": 0,
        "includeAll": true,
        "label": "环境",
        "multi": true,
        "name": "environment",
        "options": [],
        "query": "label_values(ai_ide_llm_requests_total, environment)",
        "refresh": 2,
        "regex": "",
        "skipUrlSync": false,
        "sort": 1,
        "type": "query"
      }
    ]
  },
  "time": { "from": "now-6h", "to": "now" },
  "timepicker": {
    "refresh_intervals": ["5s", "10s", "30s", "1m", "5m", "15m", "30m", "1h", "2h", "1d"]
  },
  "timezone": "browser",
  "title": "AI IDE - 可观测性仪表盘",
  "uid": "ai-ide-observability",
  "version": 1
}
7.3 追踪数据可视化
{
  "panels": [
    {
      "datasource": "Tempo",
      "fieldConfig": {
        "defaults": {
          "color": { "mode": "palette-classic" },
          "custom": {
            "hideFrom": { "legend": false, "tooltip": false, "viz": false }
          },
          "mappings": []
        }
      },
      "gridPos": { "h": 12, "w": 24, "x": 0, "y": 0 },
      "id": 100,
      "options": {
        "dedupStrategy": "none",
        "legend": { "displayMode": "list", "placement": "bottom" },
        "showLabels": false,
        "showLineColor": true,
        "蜂巢视图": false,
        "spanNulls": false,
        "serviceMap": {
          "sharedLabel": { "common": false, "value": "" },
          "showMetricLabels": false
        }
      },
      "pluginVersion": "9.5.0",
      "targets": [
        {
          "expr": "{service=\"ai-ide\"}",
          "queryType": "traceQL",
          "refId": "A"
        }
      ],
      "title": "服务依赖图",
      "type": "traces"
    },
    {
      "datasource": "Tempo",
      "fieldConfig": {
        "defaults": {
          "color": { "mode": "palette-classic" },
          "custom": {
            "axisCenteredZero": false,
            "axisColorMode": "text",
            "axisLabel": "",
            "axisPlacement": "auto",
            "barAlignment": 0,
            "drawStyle": "line",
            "fillOpacity": 10,
            "gradientMode": "none",
            "hideFrom": { "legend": false, "tooltip": false, "viz": false },
            "lineInterpolation": "smooth",
            "lineWidth": 2,
            "pointSize": 5,
            "scaleDistribution": { "type": "linear" },
            "showPoints": "never",
            "spanNulls": true,
            "stacking": { "group": "A", "mode": "none" },
            "thresholdsStyle": { "mode": "off" }
          },
          "mappings": [],
          "thresholds": {
            "mode": "absolute",
            "steps": [{ "color": "green", "value": null }]
          },
          "unit": "short"
        }
      },
      "gridPos": { "h": 8, "w": 12, "x": 0, "y": 12 },
      "id": 101,
      "options": {
        "legend": { "calcs": ["mean", "max"], "displayMode": "table", "placement": "bottom" },
        "tooltip": { "mode": "multi", "sort": "desc" }
      },
      "targets": [
        {
          "expr": "sum by (operation_name) (rate(tempo_spans_total{operation_name=~\"LLM\\..*\"}[5m]))",
          "legendFormat": "{{ operation_name }}",
          "refId": "A"
        }
      ],
      "title": "Span 速率 (按操作)",
      "type": "timeseries"
    },
    {
      "datasource": "Tempo",
      "fieldConfig": {
        "defaults": {
          "color": { "mode": "palette-classic" },
          "custom": {
            "axisCenteredZero": false,
            "axisColorMode": "text",
            "axisLabel": "",
            "axisPlacement": "auto",
            "barAlignment": 0,
            "drawStyle": "line",
            "fillOpacity": 10,
            "gradientMode": "none",
            "hideFrom": { "legend": false, "tooltip": false, "viz": false },
            "lineInterpolation": "smooth",
            "lineWidth": 2,
            "pointSize": 5,
            "scaleDistribution": { "type": "linear" },
            "showPoints": "never",
            "spanNulls": true,
            "stacking": { "group": "A", "mode": "none" },
            "thresholdsStyle": { "mode": "off" }
          },
          "mappings": [],
          "thresholds": {
            "mode": "absolute",
            "steps": [{ "color": "green", "value": null }]
          },
          "unit": "ms"
        }
      },
      "gridPos": { "h": 8, "w": 12, "x": 12, "y": 12 },
      "id": 102,
      "options": {
        "legend": { "calcs": ["mean", "max"], "displayMode": "table", "placement": "bottom" },
        "tooltip": { "mode": "multi", "sort": "desc" }
      },
      "targets": [
        {
          "expr": "histogram_quantile(0.99, sum by (le, operation_name) (rate(tempo_span_duration_seconds_bucket{operation_name=~\"LLM\\..*\"}[5m])))",
          "legendFormat": "P99 - {{ operation_name }}",
          "refId": "A"
        }
      ],
      "title": "Span 延迟 P99",
      "type": "timeseries"
    }
  ]
}
7.4 日志关联分析
在 Kibana 中实现日志与指标、追踪的关联:
{
  "visState": {
    "title": "AI IDE - 日志关联分析",
    "type": "lens",
    "aggs": [
      {
        "id": "1",
        "enabled": true,
        "type": "count",
        "params": {},
        "schema": "metric"
      },
      {
        "id": "2",
        "enabled": true,
        "type": "date_histogram",
        "params": {
          "field": "@timestamp",
          "interval": "auto",
          "min_doc_count": 1
        },
        "schema": "segment"
      },
      {
        "id": "3",
        "enabled": true,
        "type": "terms",
        "params": {
          "field": "level.keyword",
          "size": 5
        },
        "schema": "group"
      }
    ],
    "params": {
      "addTooltip": true,
      "addLegend": true,
      "addTimeMarker": true,
      "categories": [
        "ERROR",
        "WARN",
        "INFO"
      ]
    }
  },
  "description": "日志级别分布与趋势",
  "kibanaSavedObjectMeta": {
    "searchSourceJSON": {
      "filter": [
        {
          "query": {
            "match": {
              "service": "ai-ide"
            }
          }
        }
      ]
    }
  }
}
8. 可观测性最佳实践
本节为你提供的核心技术价值:总结可观测性体系建设中的经验教训,提供可操作的最佳实践建议。
8.1 关键设计原则
原则 | 描述 | 实施建议 |
|---|---|---|
面向失败设计 | 假设系统会失败 | 记录足够的上下文用于调试 |
数据治理 | 规范数据采集 | 统一字段命名、类型、格式 |
分层监控 | 从基础设施到业务 | 指标→服务→用户体验 |
告警疲劳控制 | 减少无效告警 | 智能聚合、自适应阈值 |
持续优化 | 根据实际情况调整 | 定期回顾告警命中率 |
8.2 常见陷阱与规避
陷阱 | 表现 | 规避方法 |
|---|---|---|
过度监控 | 告警泛滥、存储成本激增 | 明确监控目标、采样策略 |
监控不足 | 问题发现滞后 | 确定关键指标、SLO |
缺乏上下文 | 告警无法定位问题 | 结构化日志、关联 ID |
单点故障 | 监控自身不可用 | 独立部署、冗余配置 |
数据孤岛 | 日志/指标/追踪割裂 | 统一 Trace ID、统一标签 |
8.3 容量规划指南
基于可观测性数据进行容量规划:
# src/observability/capacity_planning.py
import numpy as np
from datetime import datetime, timedelta
from typing import List, Dict, Tuple

class CapacityPlanner:
    """容量规划器"""

    def __init__(self, data_points: List[Tuple[datetime, float]]):
        self.data_points = sorted(data_points, key=lambda x: x[0])

    def calculate_growth_rate(self, window_days: int = 7) -> float:
        """计算增长率"""
        if len(self.data_points) < 2:
            return 0.0

        recent = [v for t, v in self.data_points if t >= datetime.now() - timedelta(days=window_days)]
        older = [v for t, v in self.data_points
                 if datetime.now() - timedelta(days=window_days*2) <= t < datetime.now() - timedelta(days=window_days)]

        if not recent or not older:
            return 0.0

        recent_avg = np.mean(recent)
        older_avg = np.mean(older)

        if older_avg == 0:
            return 0.0

        return (recent_avg - older_avg) / older_avg

    def predict_capacity(
        self,
        current_capacity: float,
        threshold: float = 0.8,
        days_to_predict: int = 90
    ) -> Tuple[datetime, datetime]:
        """
        预测何时达到容量阈值
        返回: (达到阈值的日期, 容量耗尽的日期)
        """
        if len(self.data_points) < 7:
            return (datetime.max, datetime.max)

        growth_rate = self.calculate_growth_rate()

        if growth_rate <= 0:
            return (datetime.max, datetime.max)

        # 简单线性预测
        current_value = self.data_points[-1][1]

        # 达到阈值的日期
        days_to_threshold = 0
        if growth_rate > 0:
            target_value = current_capacity * threshold
            daily_growth = current_value * growth_rate / len(self.data_points)
            if daily_growth > 0:
                days_to_threshold = (target_value - current_value) / daily_growth

        threshold_date = datetime.now() + timedelta(days=days_to_threshold)

        # 容量耗尽的日期
        days_to_capacity = 0
        if growth_rate > 0:
            remaining_capacity = current_capacity - current_value
            daily_growth = current_value * growth_rate / len(self.data_points)
            if daily_growth > 0:
                days_to_capacity = remaining_capacity / daily_growth

        capacity_date = datetime.now() + timedelta(days=days_to_capacity)

        return (threshold_date, capacity_date)

    def calculate_required_capacity(
        self,
        target_date: datetime,
        safety_margin: float = 1.2
    ) -> float:
        """计算目标日期所需容量"""
        if len(self.data_points) < 7:
            return 0.0

        current_value = self.data_points[-1][1]
        growth_rate = self.calculate_growth_rate()
        days_elapsed = (target_date - datetime.now()).days

        if growth_rate <= 0:
            return current_value * safety_margin

        future_value = current_value * ((1 + growth_rate) ** (days_elapsed / 30))

        return future_value * safety_margin
9. 总结与展望
本文系统讲解了 AI IDE 可观测性体系建设的核心内容:
核心技术要点:
- 日志规范:采用结构化 JSON 日志,统一的日志级别规范,智能采样策略减少存储成本
- 日志收集:Filebeat/Fluentd/Vector 各有优势,Vector 在性能上领先,Filebeat 与 ELK 生态集成最佳
- 指标采集:Prometheus 是云原生监控的事实标准,合理使用 Counter/Gauge/Histogram/Summary 四种指标类型
- 分布式追踪:OpenTelemetry 提供厂商无关的追踪方案,通过 Trace ID 实现跨服务请求关联
- 告警系统:分层告警架构(阈值/趋势/智能),避免告警疲劳,提高告警有效性
- 可视化仪表盘:Grafana + Tempo + Elasticsearch 构建统一的可观测性平台
未来发展趋势:
- eBPF 技术:在内核层面实现无侵入式监控
- AI 驱动运维:基于机器学习的异常检测和根因分析
- OpenTelemetry 统一:日志、指标、追踪进一步融合
- 可观测性左移:在开发阶段嵌入可观测性能力
可观测性不是一次性工程,而是持续演进的过程。建议从本文的实践案例出发,根据实际情况逐步建设,并建立持续优化机制。
参考链接:
- 主要来源:Google SRE Handbook - Google SRE 最佳实践
- 主要来源:OpenTelemetry Documentation - OpenTelemetry 官方文档
- 主要来源:Prometheus Documentation - Prometheus 监控指南
- 主要来源:Grafana Loki Architecture - Grafana 日志系统架构
- 主要来源:Kubernetes Monitoring Guide - K8s 监控指南
附录(Appendix):
A. 完整的 Prometheus Alertmanager 配置
# alertmanager-config.yaml - 完整配置
apiVersion: monitoring.coreos.com/v1alpha1
kind: AlertmanagerConfig
metadata:
  name: ai-ide-alert-config
  namespace: ai-ide-monitoring
spec:
  receivers:
    - name: 'default'
      slackConfigs:
        - channel: '#alerts'
          sendResolved: true
          apiURL: '${SLACK_WEBHOOK_URL}'
          actions:
            - type: 'button'
              text: 'Runbook'
              url: '{{ range .Alerts }}{{ if .Annotations.runbook_url }}{{ .Annotations.runbook_url }}{{ end }}{{ end }}'
              style: 'primary'
          fields:
            - title: 'Alert'
              value: '{{ range .Alerts }}{{ .Annotations.summary }}{{ end }}'
              short: true
            - title: 'Severity'
              value: '{{ range .Alerts }}{{ .Labels.severity }}{{ end }}'
              short: true
          msg:
            title: '{{ if eq .Status "firing" }}🚨{{ else }}✅{{ end }} {{ .GroupLabels.alertname }}'
            text: |
              {{ range .Alerts }}
              **{{ .Annotations.summary }}**

              {{ .Annotations.description }}

              Started: {{ .StartsAt }}
              {{ end }}

    - name: 'critical'
      pagerdutyConfigs:
        - serviceKey: '${PAGERDUTY_KEY}'
          severity: critical
          sendResolved: true
          component: 'ai-ide'
          group: 'platform'

  route:
    receiver: 'default'
    groupBy: ['alertname', 'cluster']
    groupWait: 30s
    groupInterval: 5m
    repeatInterval: 4h
    routes:
      - match:
          severity: critical
        receiver: 'critical'
        groupWait: 0s
        repeatInterval: 1h
B. Grafana Dashboard 变量配置
{
  "templating": {
    "list": [
      {
        "name": "datasource",
        "type": "datasource",
        "query": "prometheus"
      },
      {
        "name": "service",
        "type": "query",
        "datasource": "Prometheus",
        "query": "label_values(ai_ide_llm_requests_total, service)"
      },
      {
        "name": "model",
        "type": "query",
        "datasource": "Prometheus",
        "query": "label_values(ai_ide_llm_requests_total{model=~\"$service\"}, model)"
      },
      {
        "name": "instance",
        "type": "query",
        "datasource": "Prometheus",
        "query": "label_values(node_cpu_seconds_total{instance=~\"$service.*\"}, instance)"
      }
    ]
  }
}
C. OpenTelemetry Collector 高可用配置
# otel-collector-ha.yaml
apiVersion: opentelemetry.io/v1alpha1
kind: OpenTelemetryCollector
metadata:
  name: ai-ide-otel
  namespace: ai-ide-monitoring
spec:
  mode: daemonset
  replicas: 3
  config: |
    receivers:
      otlp:
        protocols:
          grpc:
            endpoint: 0.0.0.0:4317
          http:
            endpoint: 0.0.0.0:4318

    processors:
      batch:
        timeout: 5s
        send_batch_size: 1024

      memory_limiter:
        check_interval: 1s
        limit_mib: 512

    exporters:
      otlp/tempo:
        endpoint: tempo:4317
        tls:
          insecure: false

      prometheusremotewrite:
        endpoint: prometheus:9090/api/v1/write

    service:
      pipelines:
        traces:
          receivers: [otlp]
          processors: [memory_limiter, batch]
          exporters: [otlp/tempo]
        metrics:
          receivers: [otlp]
          processors: [memory_limiter, batch]
          exporters: [prometheusremotewrite]
D. 可观测性检查清单
类别 | 检查项 | 状态 |
|---|---|---|
日志 | 结构化日志实现 | ☐ |
日志级别规范 | ☐ | |
日志采样策略 | ☐ | |
日志收集配置 | ☐ | |
日志保留策略 | ☐ | |
指标 | 核心业务指标定义 | ☐ |
SLO 指标定义 | ☐ | |
Recording Rules | ☐ | |
告警规则 | ☐ | |
Pushgateway 配置(可选) | ☐ | |
追踪 | OpenTelemetry SDK 集成 | ☐ |
Trace ID 传播 | ☐ | |
Span 命名规范 | ☐ | |
采样策略 | ☐ | |
Tail Sampling 配置 | ☐ | |
告警 | 告警级别定义 | ☐ |
告警路由配置 | ☐ | |
静默规则 | ☐ | |
抑制规则 | ☐ | |
告警模板 | ☐ | |
可视化 | 概览仪表盘 | ☐ |
服务详情仪表盘 | ☐ | |
SLO 仪表盘 | ☐ | |
追踪关联视图 | ☐ | |
运维 | 容量规划 | ☐ |
灾难恢复计划 | ☐ | |
演练计划 | ☐ |
关键词: 可观测性、日志收集、Prometheus、OpenTelemetry、Grafana、告警系统、分布式追踪、结构化日志、指标采集、SLO 监控

在这里插入图片描述
本文参与 腾讯云自媒体同步曝光计划,分享自作者个人站点/博客。
原始发表:2026-06-02,如有侵权请联系 cloudcommunity@tencent.com 删除
评论
登录后参与评论
推荐阅读
目录
腾讯云开发者

Copyright © 2013 - 2026 Tencent Cloud. All Rights Reserved. 腾讯云 版权所有
深圳市腾讯计算机系统有限公司 ICP备案/许可证号:粤B2-20090059 ![]() 粤公网安备44030502008569号
粤公网安备44030502008569号
腾讯云计算(北京)有限责任公司 京ICP证150476号 | 京ICP备11018762号