如何使用 OTel + Elastic 获取 Hermes 的可观测性
原创
如何使用 OTel + Elastic 获取 Hermes 的可观测性
原创
点火三周
发布于 2026-06-18 13:21:29
发布于 2026-06-18 13:21:29
一份写给实战派的操作手册。不讲概念,只讲怎么做、为什么这么做。
第一步:零侵入埋点
原理
opentelemetry-instrument 命令在 Python 解释器启动时,通过 sitecustomize 机制向 __import__ 系统注入了一个导入钩子(Import Hook)。这个钩子不关心模块是在启动时加载还是在运行时加载——只要任何代码在任何时刻执行了 import openai,钩子就会实时拦截这次导入,把拦截器注入到刚加载的模块中。
换句话说,Hermes 的延迟加载反而帮了忙:当用户发消息触发 import openai 的瞬间,OTel 的钩子已经在那里等着了。真正的零代码自动埋点。
安装依赖
在 Hermes 的虚拟环境中执行:
pip install opentelemetry-distro opentelemetry-exporter-otlp opentelemetry-instrumentation-openai三个包,各司其职:
opentelemetry-distro:SDK 核心 +opentelemetry-instrument命令行入口opentelemetry-exporter-otlp:将 Trace 数据通过 OTLP 协议发送到 Elasticopentelemetry-instrumentation-openai:针对 OpenAI SDK 的自动埋点库,遵循 GenAI 语义约定
配置 Systemd 服务
编辑 Hermes 的 systemd override 文件:
sudo systemctl edit hermes-agent写入以下内容:
[Service]
ExecStart=
ExecStart=/root/.hermes/hermes-agent/venv/bin/opentelemetry-instrument /root/.hermes/hermes-agent/venv/bin/python -m hermes_cli.main gateway run --replace
Environment="OTEL_EXPORTER_OTLP_ENDPOINT=https://lex-demo.ingest.ap-east-1.aws.elastic-cloud.com:443"
Environment="OTEL_EXPORTER_OTLP_HEADERS=Authorization=ApiKey UlVpRXNKNEJIT2laXXlPQTRuN1I6N2tCTkpXxXX1dDM2di1xeFVFQjIwUQ=="
Environment="OTEL_RESOURCE_ATTRIBUTES=service.name=hermes_agent,service.version=2.0.0,deployment.environment=production"
Environment="OTEL_INSTRUMENTATION_GENAI_CAPTURE_MESSAGE_CONTENT=true"
注意第一行空的 ExecStart=——这是 systemd override 的语法要求,用于清除原始 unit 文件中的启动命令。
并且,我们还配置了:
OTEL_RESOURCE_ATTRIBUTES=service.name=hermes_agent,service.version=2.0.0,deployment.environment=production,这会为 Hermes 服务添加一些默认的标签,方便在 Elastic 中查询, 比如,service.name=hermes_agent。OTEL_INSTRUMENTATION_GENAI_CAPTURE_MESSAGE_CONTENT=true,这会触发 OTel GenAI 语义约定的自动埋点,包括多轮对话的 Prompt 和 Response。
然后重载并重启:
sudo systemctl daemon-reload
sudo systemctl restart hermes-agent
第二步:在 Elastic 侧解析 GenAI 对话内容
Trace 数据到了 Elastic,你会发现一个让人抓狂的事实:OTel GenAI 语义约定把多轮对话的 Prompt 和 Response 序列化成了一坨 JSON 字符串,塞在 attributes["gen_ai.output.messages"] 这样的扁平字段里。里面充斥着 \" 转义,中文全部变成了 \u8fd9\u4e2a 这样的 Unicode 码点。
比如这个:
[{"role": "assistant", "parts": [{"content": "HEARTBEAT_OK", "type": "text"}, {"type": "reasoning", "content": "\u811a\u672c\u8fd0\u884c\u6210\u529f\uff0c\u6ca1\u6709\u4efb\u4f55\u8f93\u51fa\u3002\u6839\u636e\u7528\u6237\u7684\u6307\u793a\uff0c\u5982\u679c\u6ca1\u6709\u4efb\u4f55\u8f93\u51fa\uff0c\u6211\u5e94\u8be5\u53ea\u56de\u590d \"HEARTBEAT_OK"}], "finish_reason": "stop"}]你没法搜索,没法阅读,没法做任何有意义的分析。
解决方案:创建一个 Ingest Pipeline,在数据写入时自动反序列化、清洗、结构化。
创建 Ingest Pipeline
在 Kibana Dev Tools 中执行:
PUT _ingest/pipeline/gen_ai_messages_parser
{
  "description": "Parse gen_ai.output.messages and gen_ai.input.messages including tool calls and reasoning",
  "processors": [
    {
      "script": {
        "lang": "painless",
        "source": "if (ctx.attributes != null && ctx.attributes.containsKey('gen_ai.output.messages')) { ctx.tmp_out = ctx.attributes['gen_ai.output.messages']; } if (ctx.attributes != null && ctx.attributes.containsKey('gen_ai.input.messages')) { ctx.tmp_in = ctx.attributes['gen_ai.input.messages']; }"
      }
    },
    { "json": { "field": "tmp_out", "target_field": "tmp_out_parsed", "ignore_failure": true } },
    { "json": { "field": "tmp_in", "target_field": "tmp_in_parsed", "ignore_failure": true } },
    {
      "script": {
        "lang": "painless",
        "source": "def processMessages = (msgs, ctx_attrs, prefix) -> { if (msgs instanceof List) { def roles = []; def texts = []; def reasonings = []; def tool_calls = []; for (def m : msgs) { if (m instanceof Map) { if (m.containsKey('role')) roles.add(m.role); if (m.containsKey('content') && m.content != null) texts.add(m.content.toString()); if (m.containsKey('parts') && m.parts instanceof List) { for (def p : m.parts) { if (p instanceof Map) { def pType = p.containsKey('type') ? p.type : 'unknown'; if (pType == 'reasoning' && p.containsKey('content') && p.content != null) { reasonings.add(p.content.toString()); } else if (pType == 'tool_call') { def tcName = p.containsKey('name') ? p.name : 'unknown_tool'; def tcArgs = p.containsKey('arguments') ? p.arguments : ''; tool_calls.add(tcName + '(' + tcArgs + ')'); } else if (p.containsKey('content') && p.content != null) { texts.add(p.content.toString()); } } } } } } if (!roles.isEmpty()) ctx_attrs[prefix + '_roles'] = roles; if (!texts.isEmpty()) ctx_attrs[prefix + '_text'] = texts; if (!reasonings.isEmpty()) ctx_attrs[prefix + '_reasoning'] = reasonings; if (!tool_calls.isEmpty()) ctx_attrs[prefix + '_tool_calls'] = tool_calls; } }; if (ctx.tmp_out_parsed != null) processMessages(ctx.tmp_out_parsed, ctx.attributes, 'gen_ai.output.messages'); if (ctx.tmp_in_parsed != null) processMessages(ctx.tmp_in_parsed, ctx.attributes, 'gen_ai.input.messages');"
      }
    },
    { "remove": { "field": ["tmp_out", "tmp_in", "tmp_out_parsed", "tmp_in_parsed"], "ignore_missing": true } }
  ]
}
这个 Pipeline 做了四件事:
- 提取原始 JSON 字符串到临时字段
- 反序列化 JSON(Elastic 内置解析器会自动将
\u8fd9\u4e2a还原为「这个」) - 结构化拆分:用 Painless 脚本将每轮对话的
role、普通文本text、思维链reasoning、工具调用tool_calls分别归入独立数组 - 清理临时字段
将 Pipeline 绑定到数据流
PUT /_data_stream/traces-generic.otel-default/_settings
{
  "index.default_pipeline": "gen_ai_messages_parser"
}
从此刻起,所有新写入的 Trace 数据都会自动经过这个 Pipeline。
备选方案:你也可以通过配置 Component Template
traces-otel@custom来实现同样的效果,这样即使数据流发生 rollover 也不会丢失配置。
回刷历史数据
已经写入的 Trace 不会自动重新处理。用 Update By Query 补刷:
POST /traces-generic.otel-default/_update_by_query?pipeline=gen_ai_messages_parser&wait_for_completion=true
{
  "query": {
    "term": {
      "name": "openai.chat"
    }
  }
}
只针对 openai.chat 类型的 span 执行,避免无意义的全量重刷。
第三步:在 Kibana 中构建可观测性视图
数据有了、结构化了,接下来是让它变得可用。但在画图之前,先记住一件事——GenAI 的 token 字段有几个语义陷阱,看错了会把账算错一个数量级。 我们边建视图边把这些坑标出来。
3.1 先看宏观:APM 服务视图
打开 Kibana → Observability → APM,找到 hermes_agent 服务。因为 OTel span 已经带了标准的 service.* 和延时信息,APM 视图开箱就能给你服务级的健康度:
- 调用吞吐与延时分布(P50 / P95 / P99)
- 错误率与异常事务
- 服务依赖拓扑(如果有下游服务)
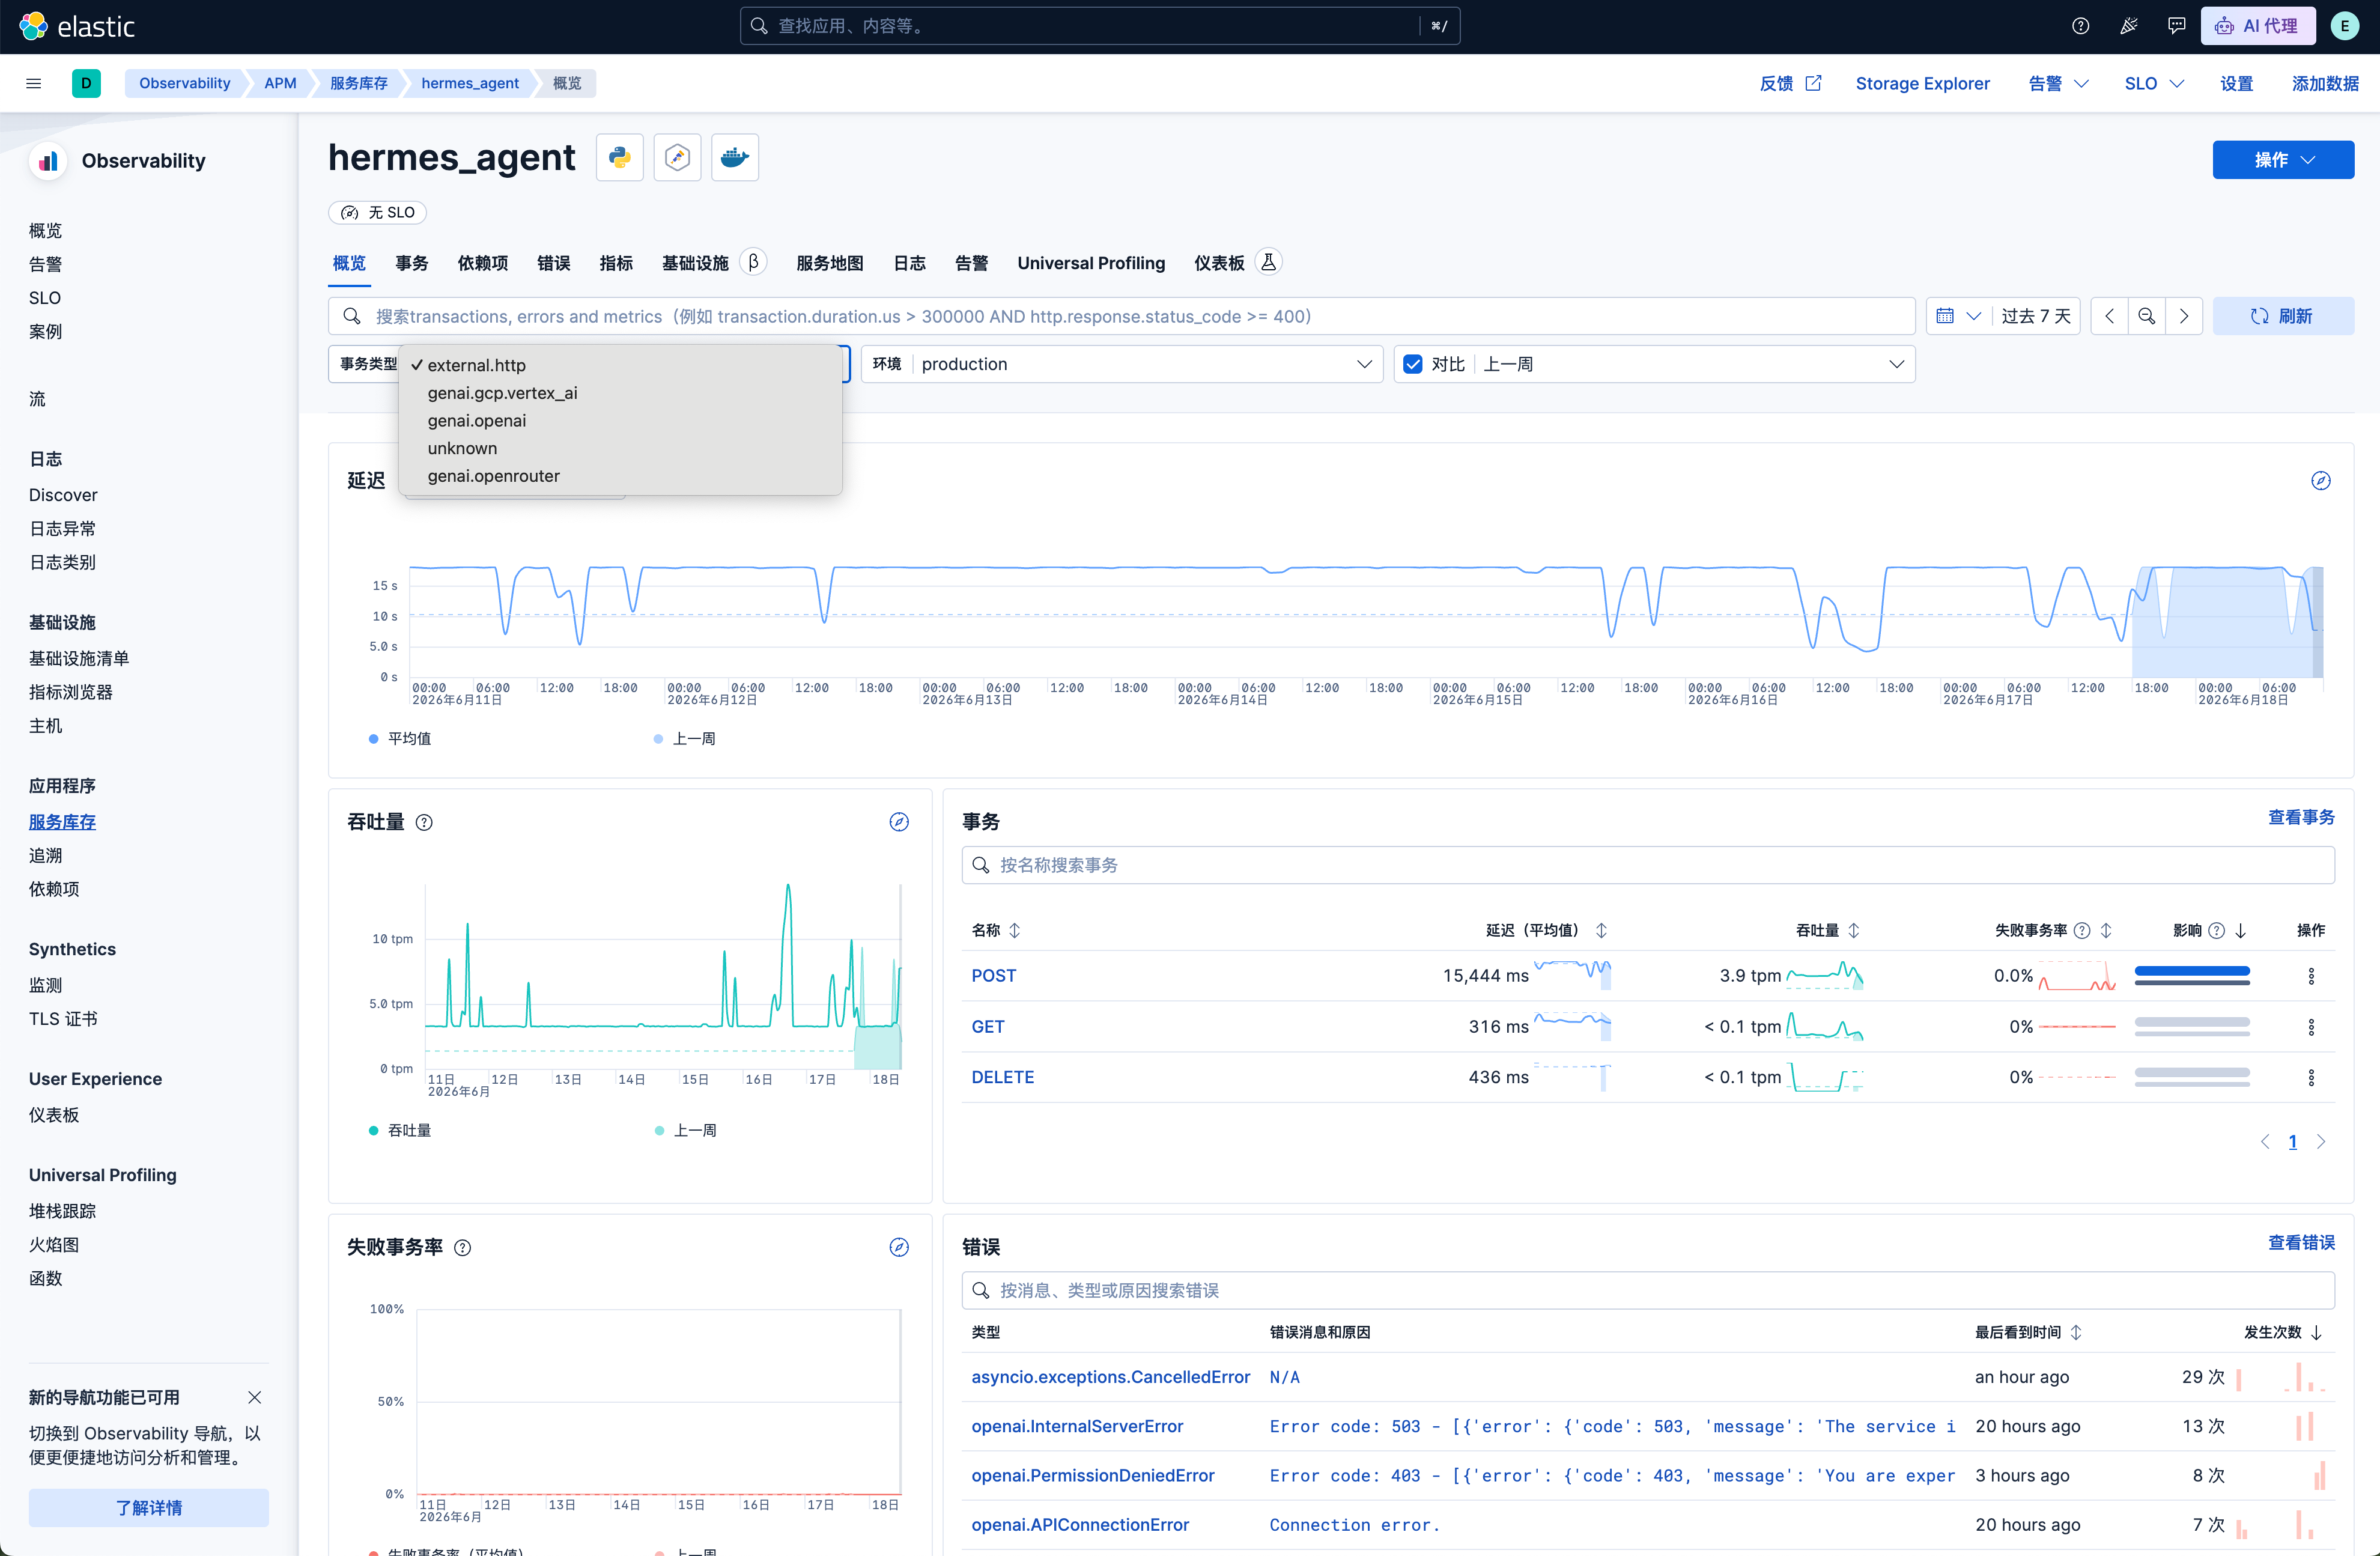
hermes-agent 服务面板
可以看到 APM 视图适合回答"服务整体健不健康"。但真正 GenAI 特有的分析(token 去哪了、对话回放、工具画像),靠下面的自定义视图和 ES|QL 更直接、更可控。
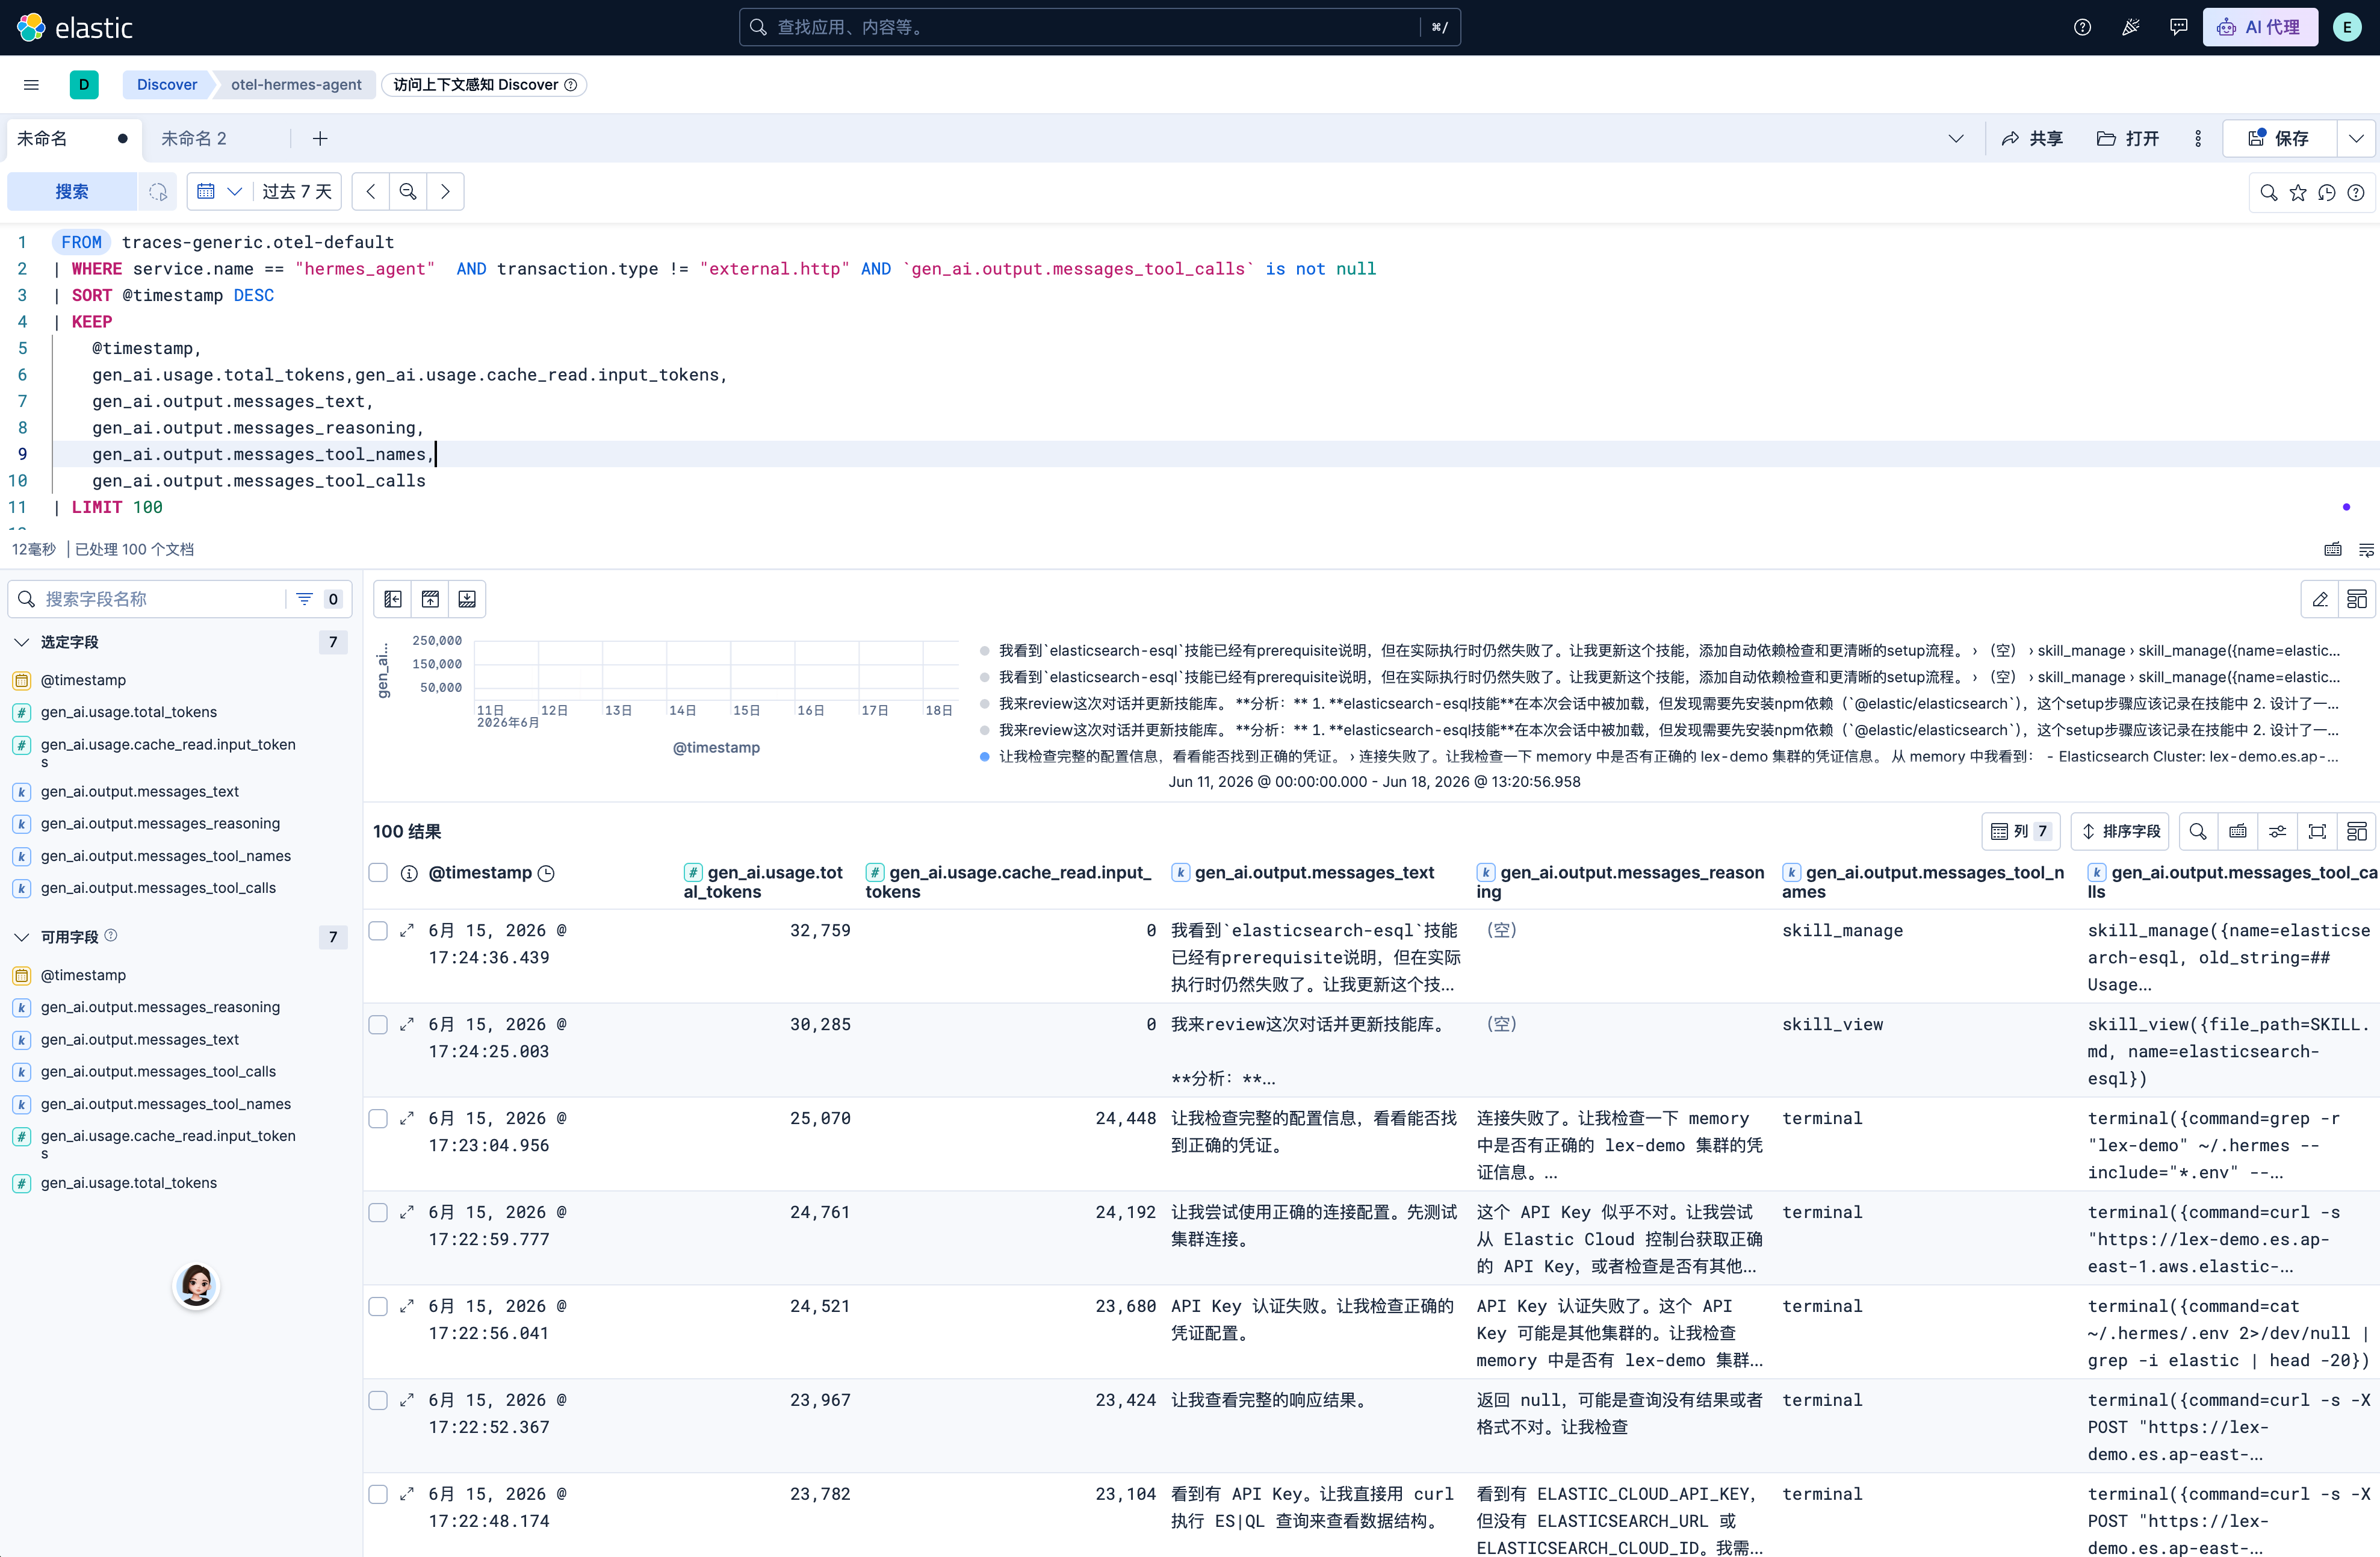
3.2 对话实时还原流(Discover)
在 Kibana → Discover 中新建视图,选择 traces-* 数据视图,按 name: "openai.chat" 过滤,添加以下字段列(用你索引里实际存在的字段名,参见第二步的对照表):
字段 | 含义 |
|---|---|
| 调用时间 |
| 请求的模型(比 |
| 输入文本(数组) |
| 模型输出文本(数组) |
| 本轮调用的工具名(数组) |
| 工具调用参数 |
| 思维链长度(数字) |
这张表就是你的大模型对话回放器。排查"模型为什么给了这个回答"时,它的价值不可替代。
3.3 一站式分析面板:Agent 使用分析 Dashboard
APM 视图负责宏观健康度,Discover 负责单次对话回放。而日常真正高频的 GenAI 分析——token 花在哪、工具怎么用、模型谁快谁省——我们沉淀成了一个专门的 Dashboard:Agent 使用分析(Agent Usage Analysis)。
它完全基于 gen_ai.* 字段用 ES|QL 构建,有一个关键设计:每个面板只按它需要的 gen_ai 字段是否存在来过滤,不写死 span 名和服务名。 所以你只要在面板顶部加一个 resource.attributes.service.name 的 Control 筛选控件,同一套 Dashboard 就能在不同 agent 服务(hermes_agent、openclaw-gateway……)之间自由切换。
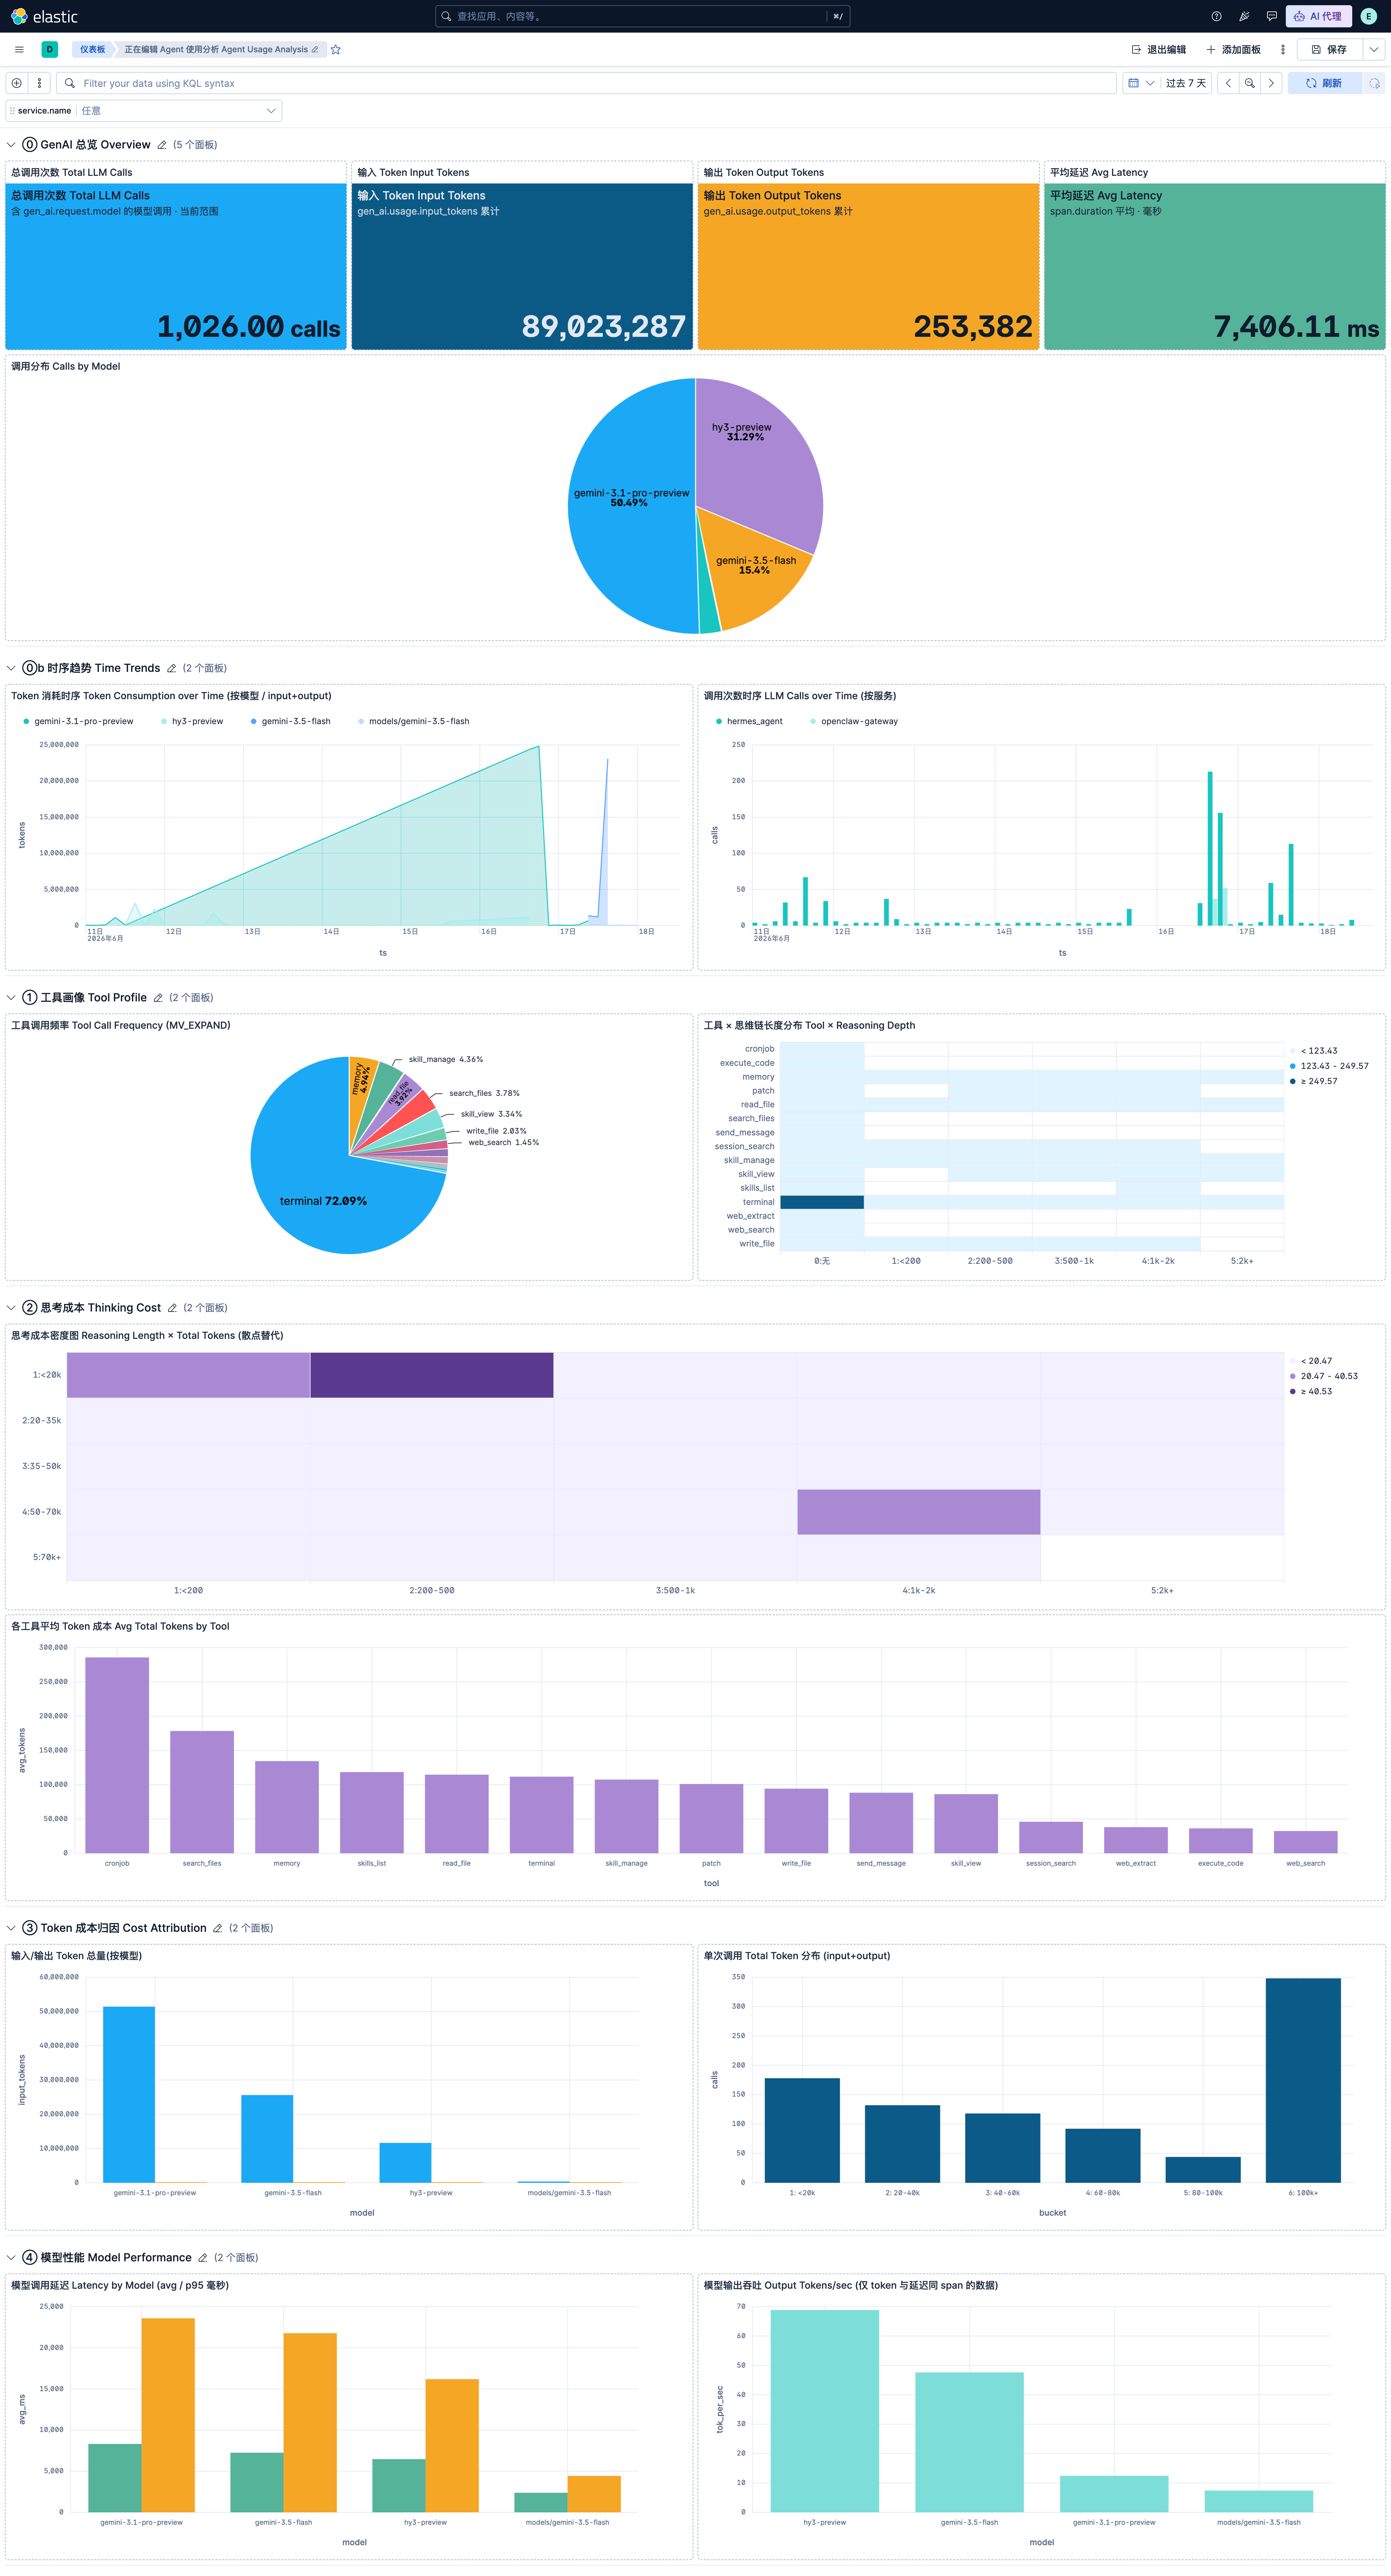
Gen_ai 仪表板
下面逐个分区说明。
⓪ 总览 Overview
最上面一排是 KPI 指标卡:总调用次数、输入 Token、输出 Token、平均延迟,每张卡都带一条迷你趋势线。旁边一个饼图给出调用按模型的分布。这一排回答"现在整体什么量级、健不健康",是每次打开 Dashboard 第一眼看的地方。
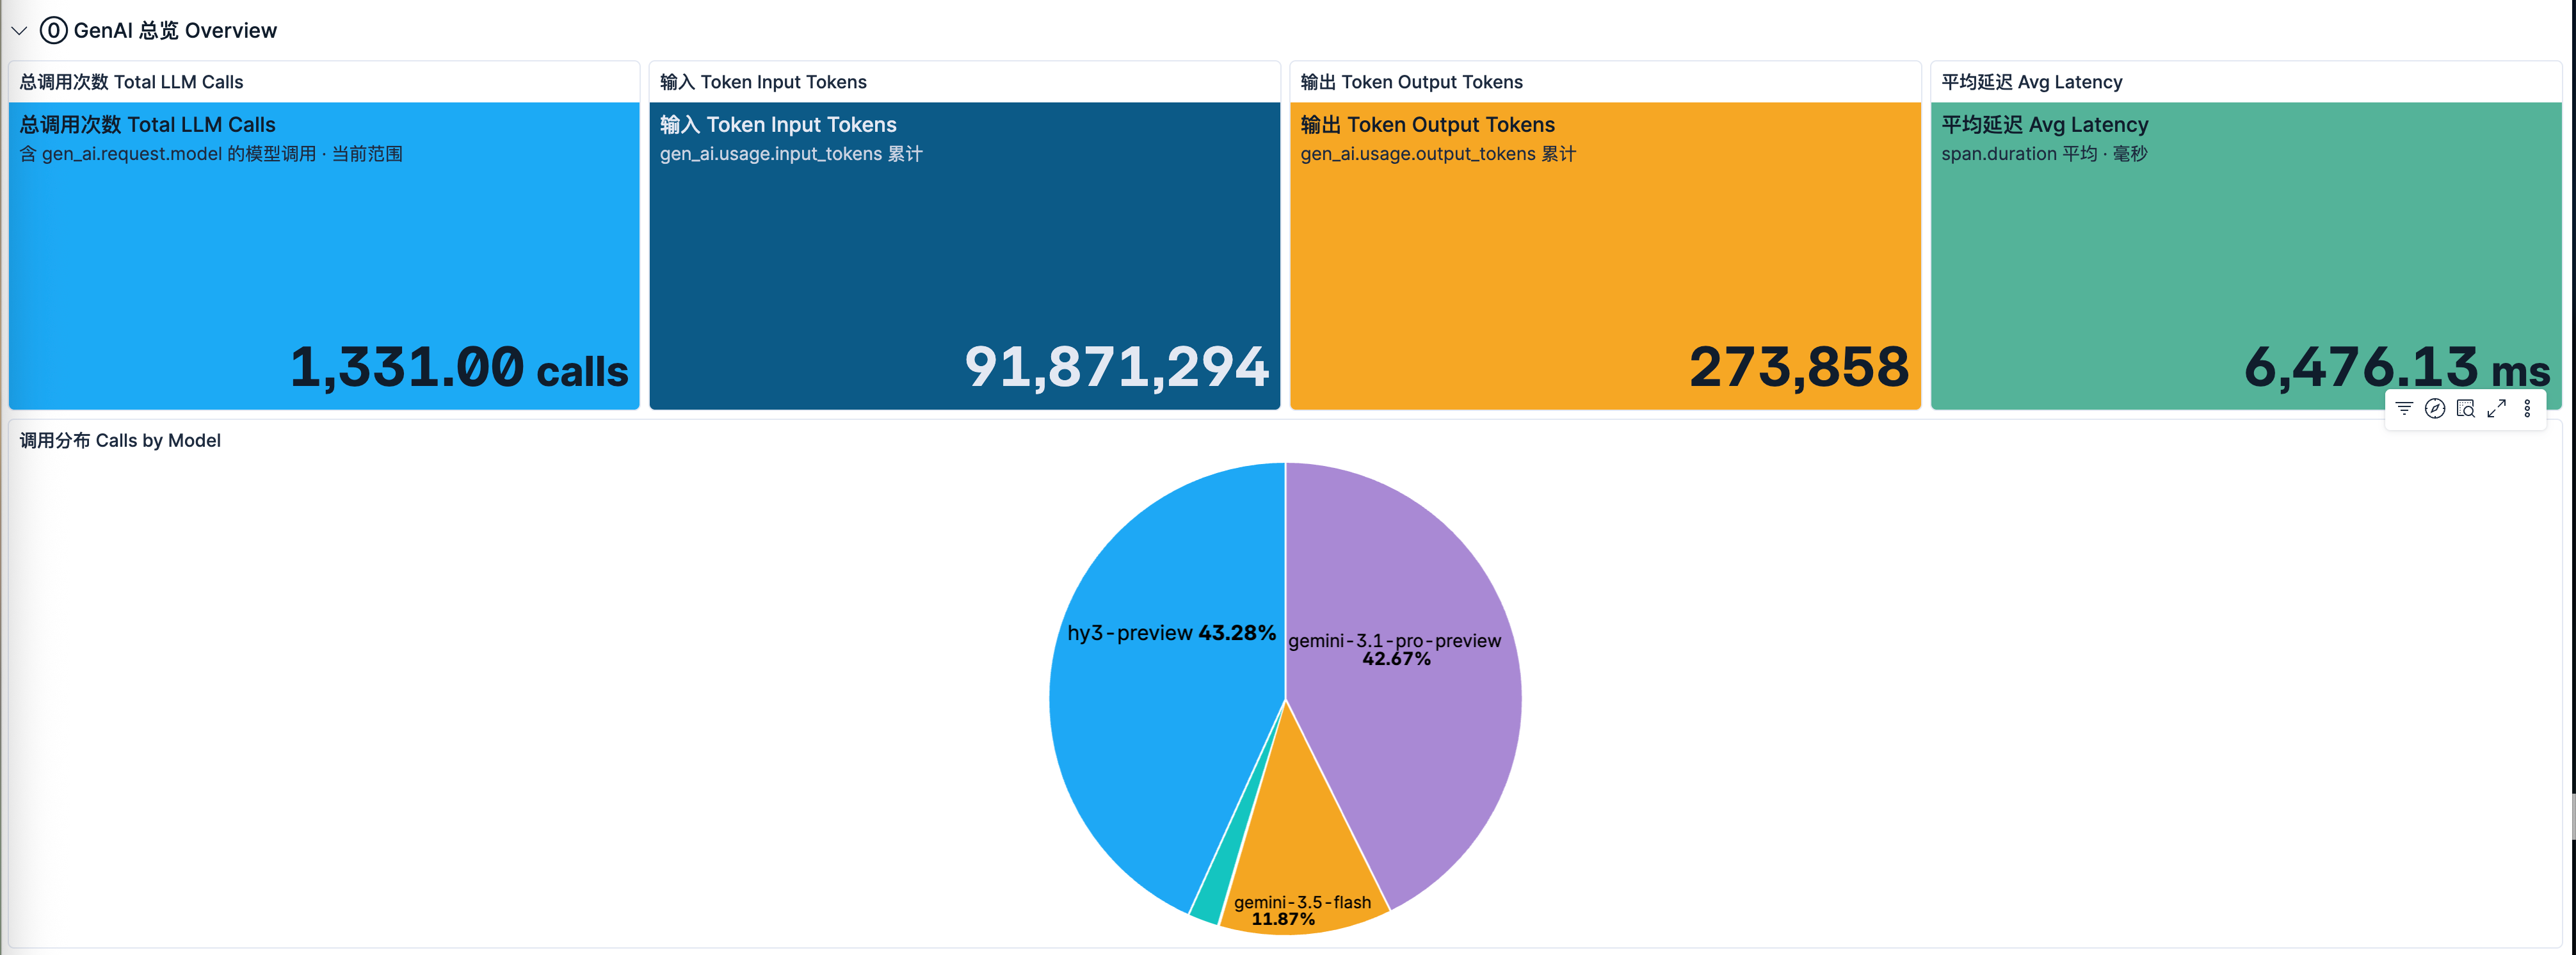
总览 Overview
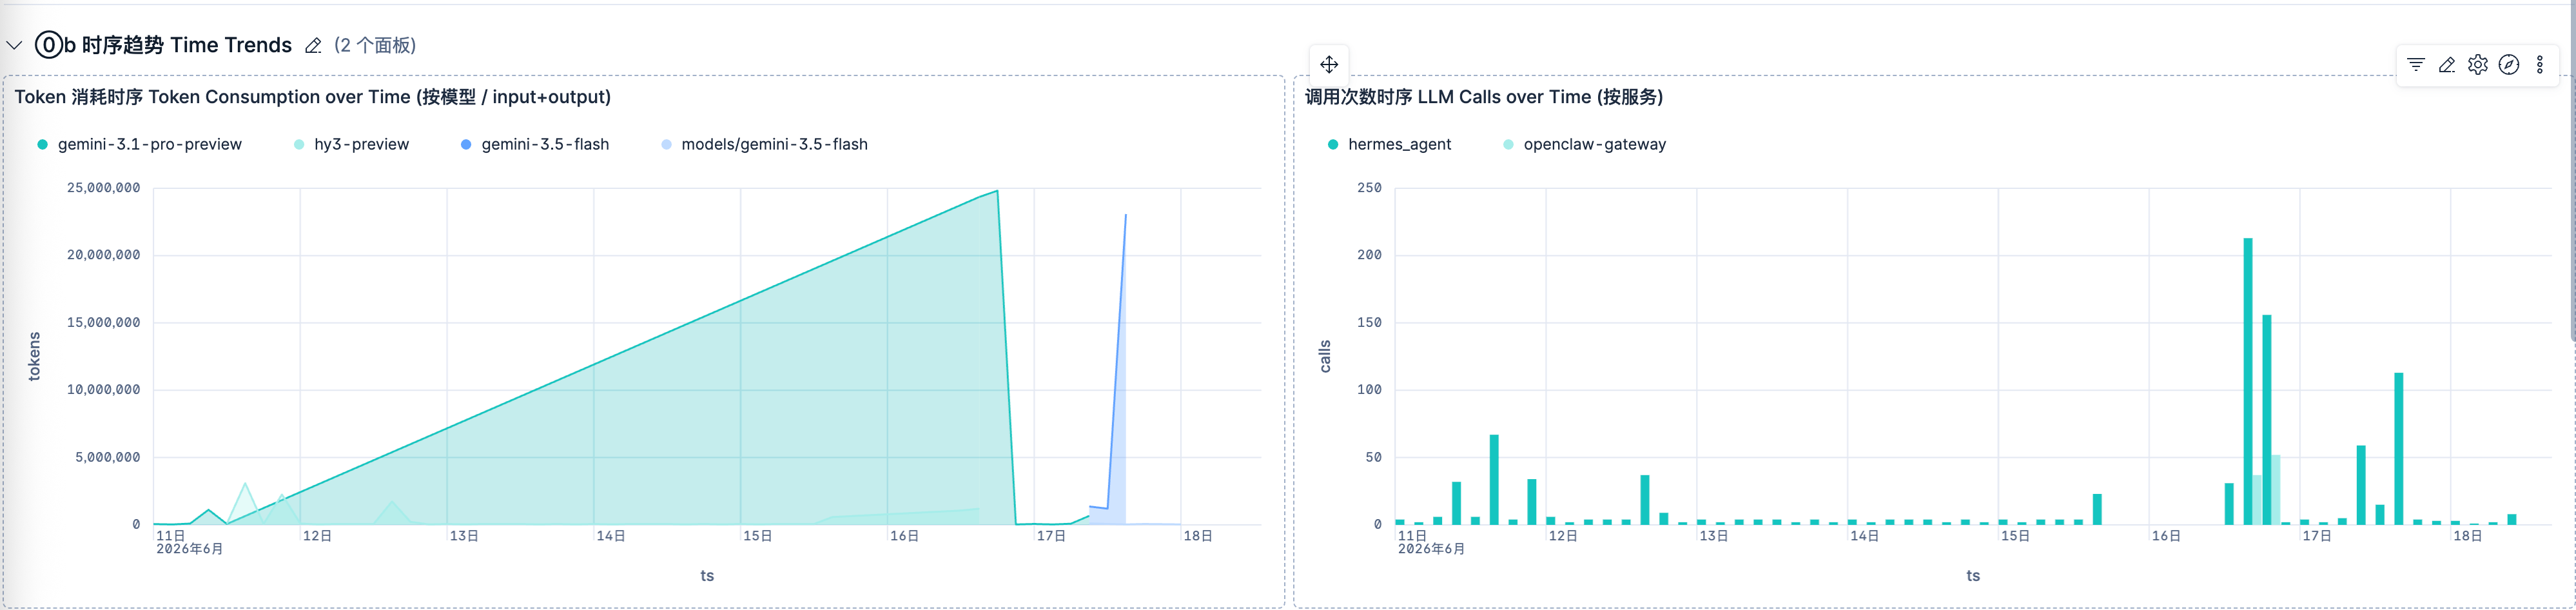
⓪b 时序趋势 Time Trends
两张时序图:Token 消耗时序(按模型拆分的堆叠面积图)和调用次数时序(按服务拆分的柱状图)。用来看用量随时间的波动、定位流量高峰。
时序趋势 Time Trends
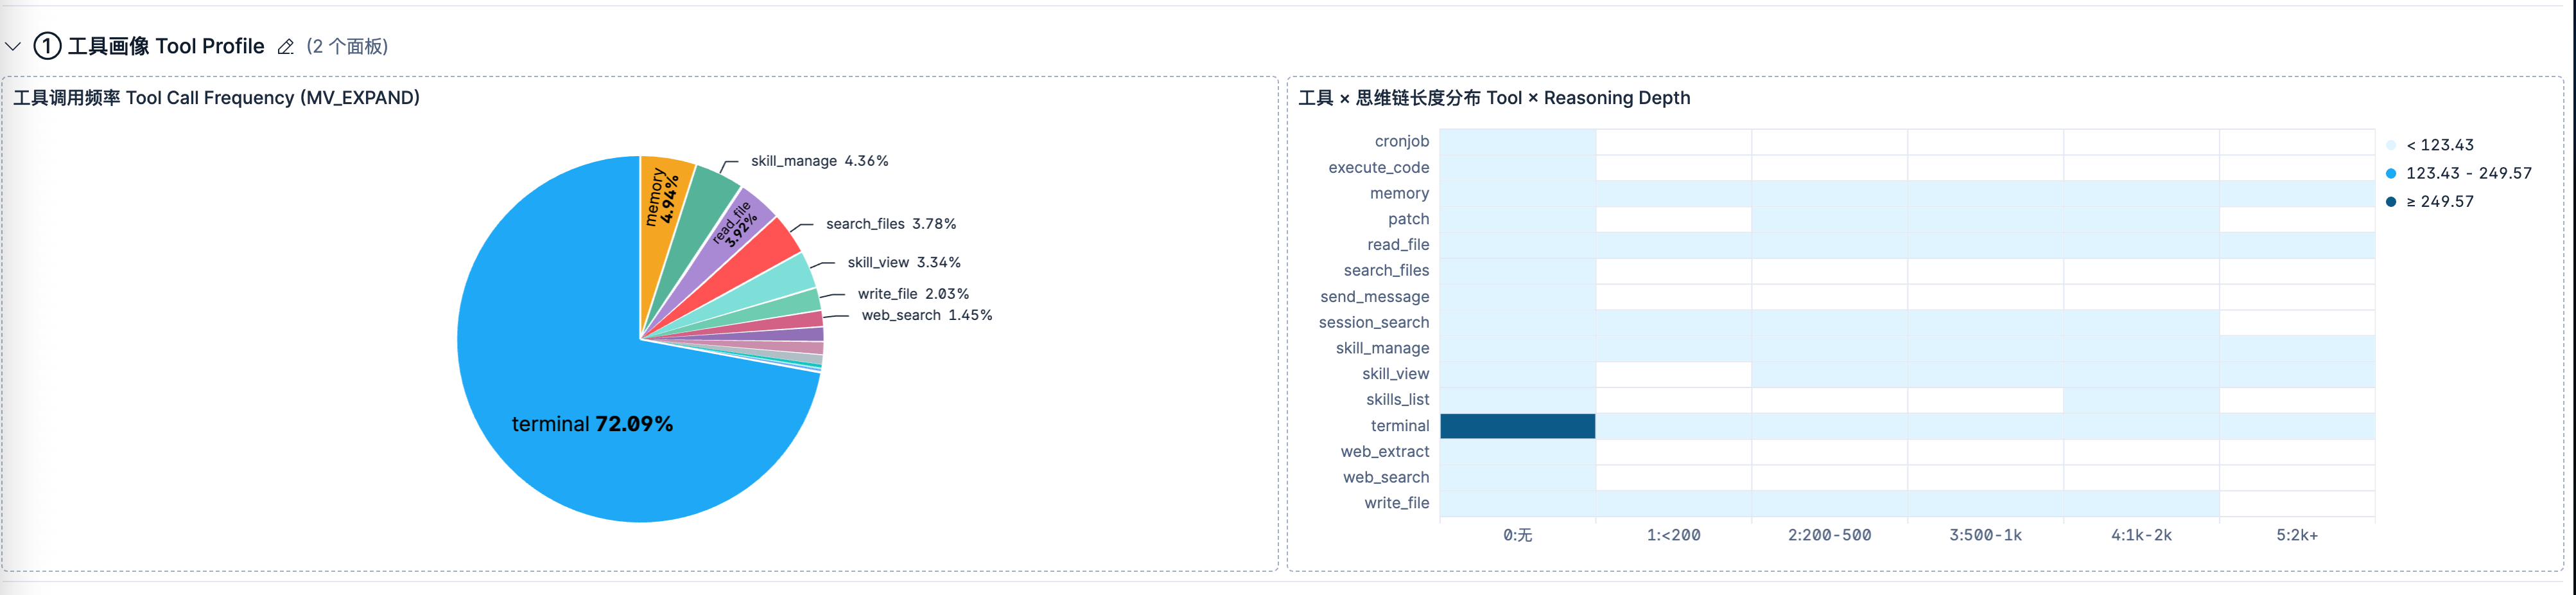
① 工具画像 Tool Profile
两张图刻画 agent 调了哪些工具、调得有多重:工具调用频率饼图,以及工具 × 思维链长度的热力图(哪些工具往往伴随更长的推理)。用来理解 agent 的行为模式。
工具画像 Tool Profile
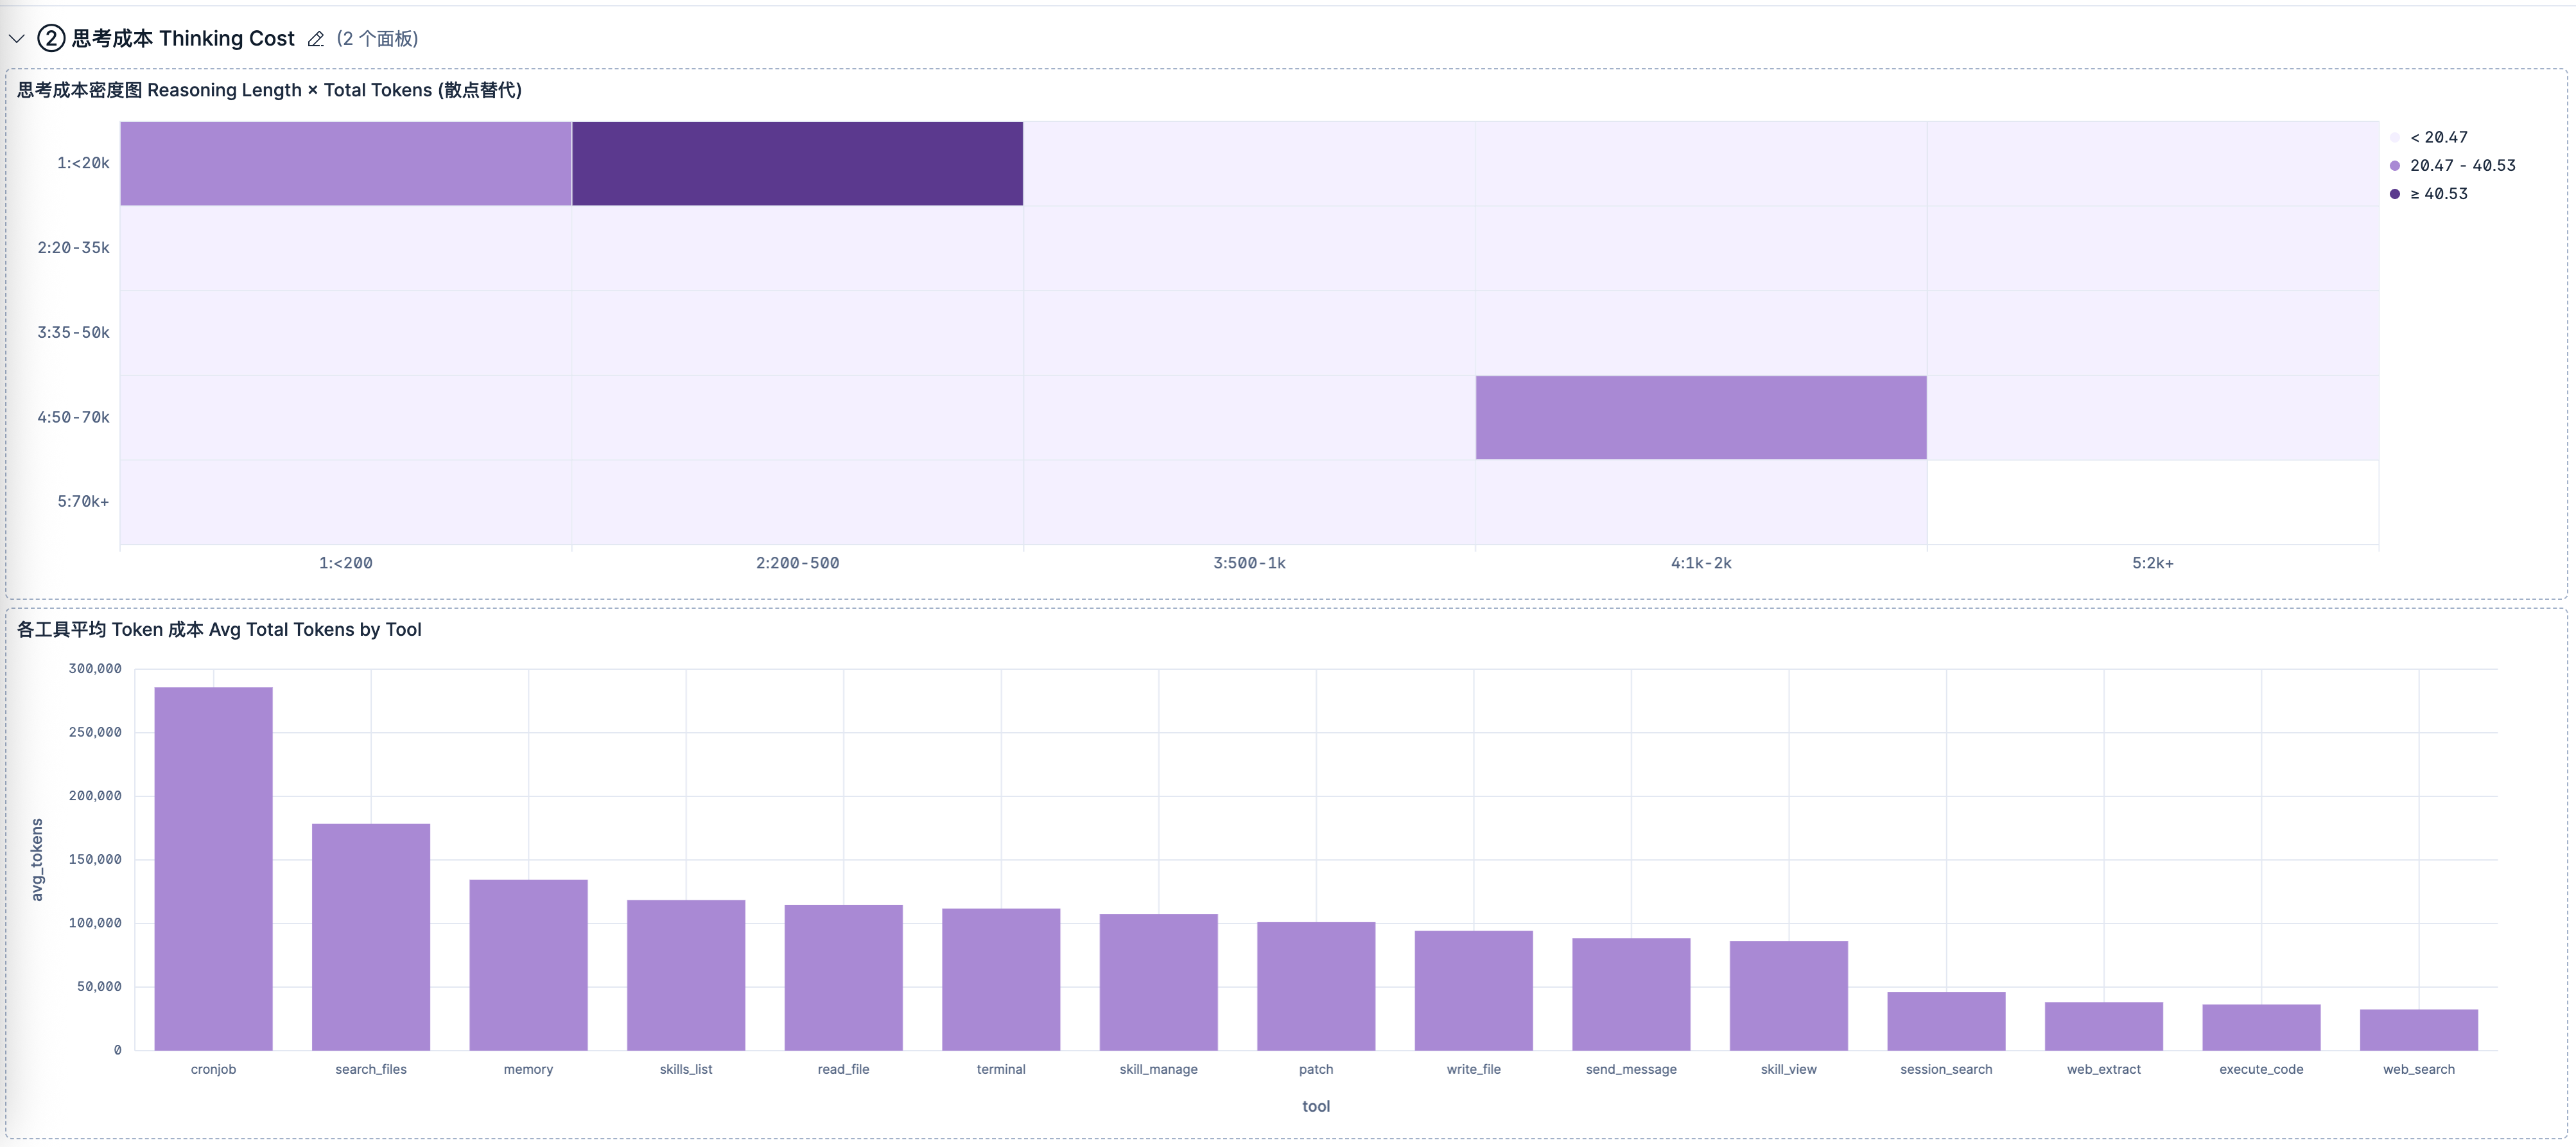
② 思考成本 Thinking Cost
聚焦"推理本身花了多少":思维链长度 × Token 消耗的密度热力图,以及各工具的平均 Token 成本柱状图。帮你发现"哪些操作既费推理又费 token"。
思考成本
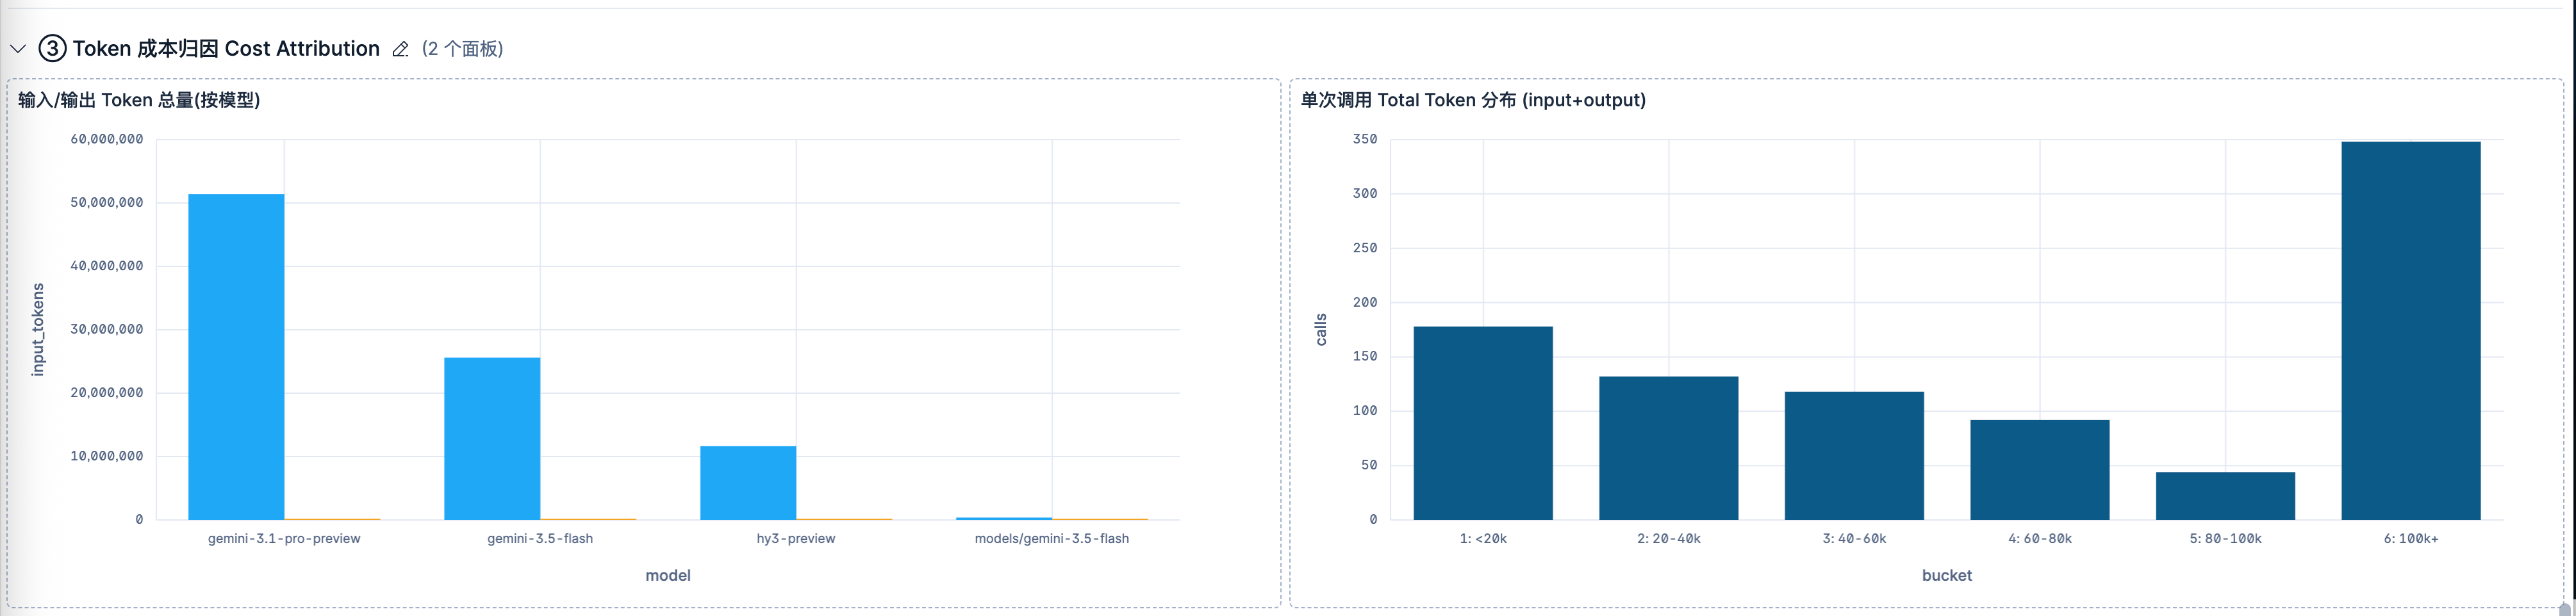
③ Token 成本归因 Cost Attribution
把 token 账单拆开看:各模型的输入/输出 Token 总量对比柱状图,以及单次调用的 Total Token 分布直方图。回答"钱主要花在哪个模型、单次调用普遍多大"。(注意输入 Token 通常远大于输出,这是长上下文 agent 的常态。)
Token 成本归因
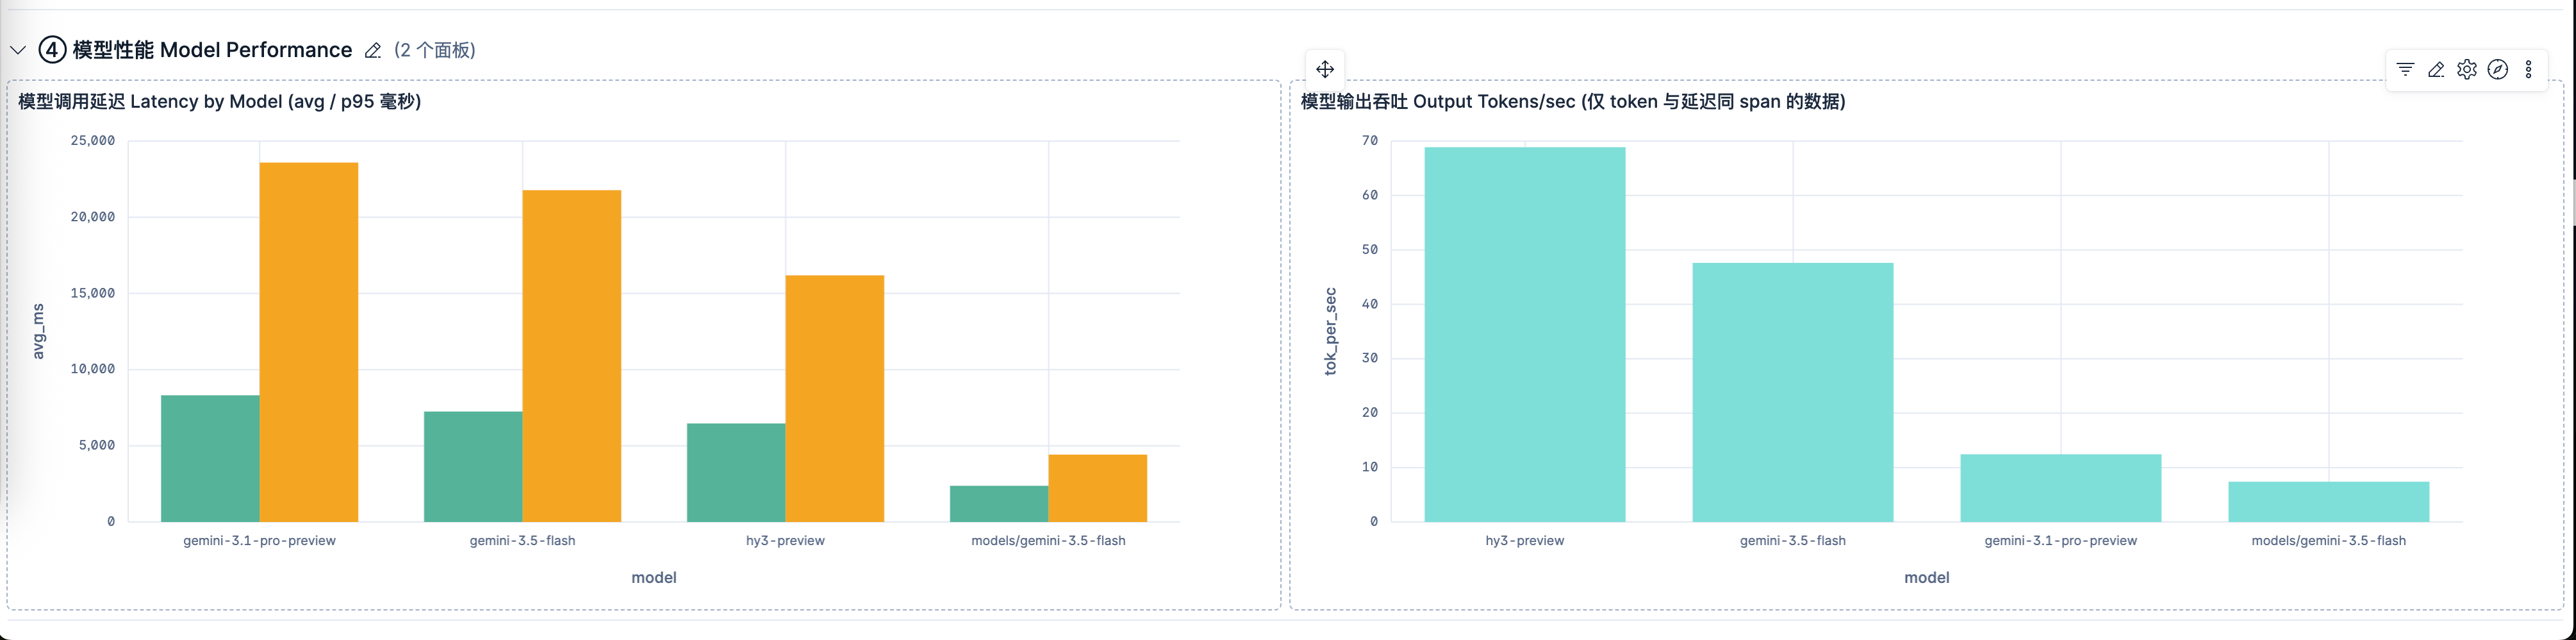
④ 模型性能 Model Performance
模型间横向对比:调用延迟(avg / p95)和输出吞吐(tokens/sec)两张柱状图。用来在多模型并存时做选型权衡——谁快、谁稳、谁的吞吐高。
写在最后
整个方案的核心思路其实就一句话:用 OTel 的导入钩子绕过 Hermes 的延迟加载,让 Elastic 把 GenAI 的扁平字段结构化,再用一个服务无关的 Dashboard 把数据变成决策。 三步,零侵入,不改一行 Hermes 源码。
最后把几个最容易踩的坑收在这里:
- 字段名用新版约定:
input_tokens/output_tokens,不是prompt_tokens/completion_tokens。 - 先查再建 pipeline:Elastic 较新版本可能已自动扁平化出
messages_*子字段,自建 pipeline 的产出名要和下游查询严格对齐。 total_tokens是单次不是会话累计:算真实账单用SUM,单行只是那一轮的上下文快照。- Dashboard 按字段而非服务名过滤:加一个 service 的 Control 控件,一套面板复用到所有 agent。
- token 账单的主角是 input 侧的常驻 + 重传,不是输出、也不是单轮 Prompt 的字数。
配置时如果遇到 401,先检查 OTLP 协议和端点是否匹配。如果 Discover 里中文显示成 Unicode 码点,说明结构化字段没生效。这两个问题覆盖了我见过的 90% 的求助。
原创声明:本文系作者授权腾讯云开发者社区发表,未经许可,不得转载。
如有侵权,请联系 cloudcommunity@tencent.com 删除。
原创声明:本文系作者授权腾讯云开发者社区发表,未经许可,不得转载。
如有侵权,请联系 cloudcommunity@tencent.com 删除。
评论
登录后参与评论
推荐阅读
目录
腾讯云开发者

Copyright © 2013 - 2026 Tencent Cloud. All Rights Reserved. 腾讯云 版权所有
深圳市腾讯计算机系统有限公司 ICP备案/许可证号:粤B2-20090059  粤公网安备44030502008569号
腾讯云计算(北京)有限责任公司 京ICP证150476号 | 京ICP备11018762号