Java内存区域划分及JVM参数

Java内存区域划分及JVM参数

码农戏码
发布于 2026-06-25 19:59:26
发布于 2026-06-25 19:59:26
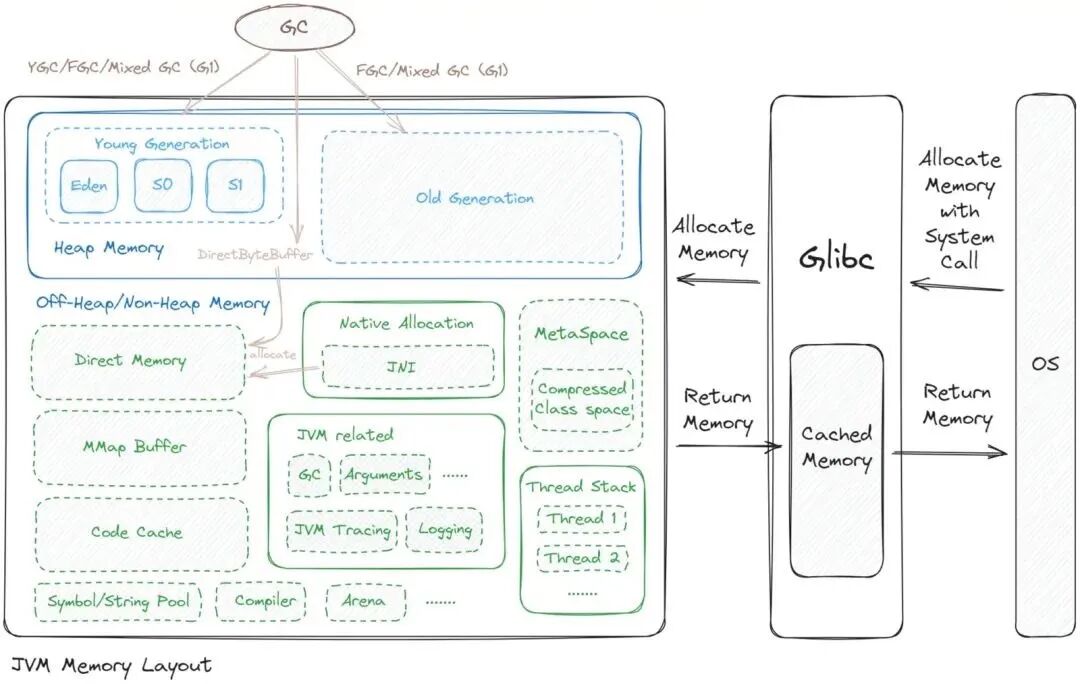
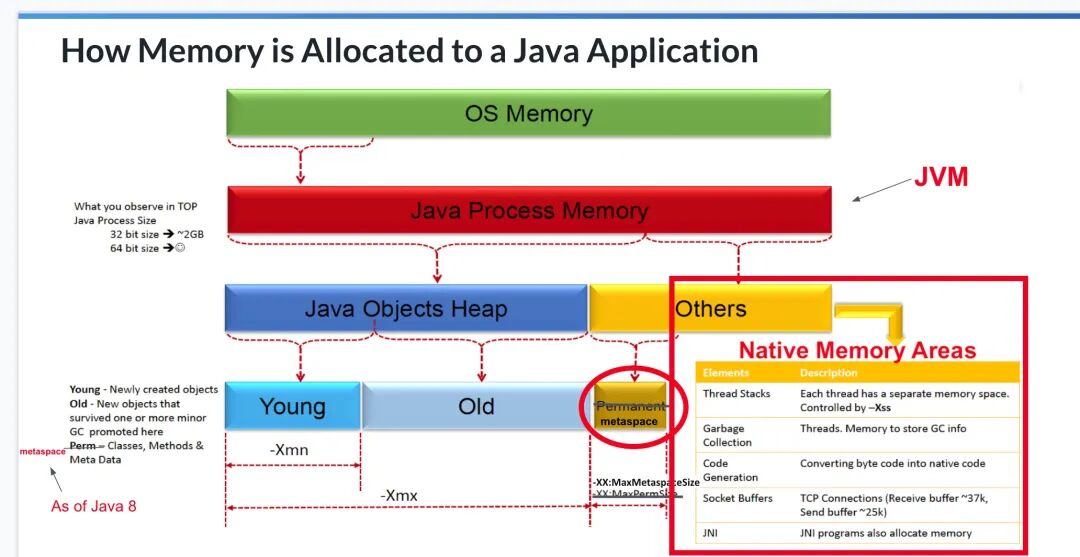
可以看到:
1、JVM 的内存被分为了不同的区域,主要由 Java 堆内存、非堆内存组成,在 Linux 上,JVM 通过 glibc 与 OS 进行内存分配与去配。
2、我们分析 Java 进程所占内存,可以从上图的各个板块着手切入。
区域划分
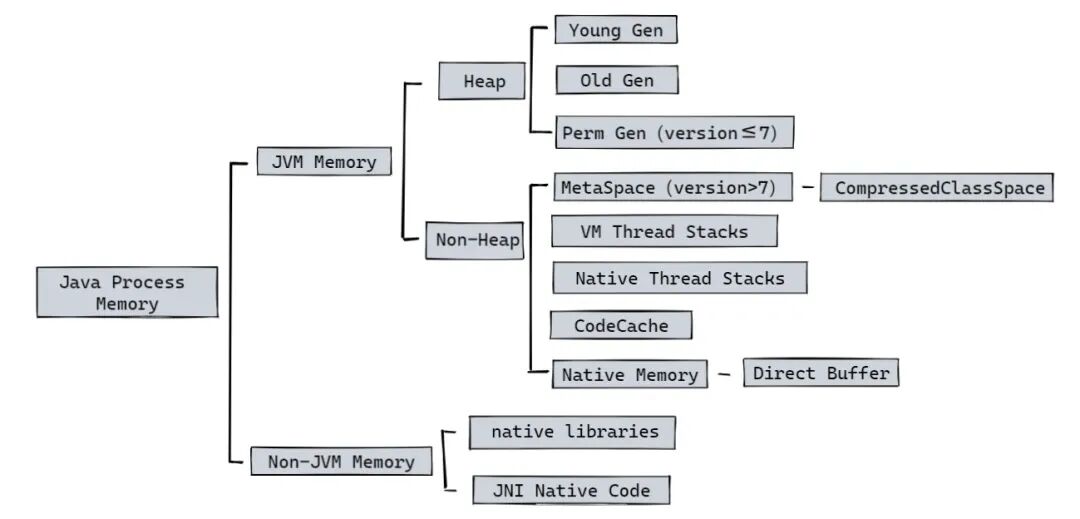
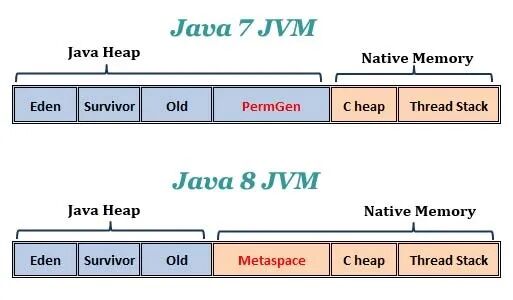
JVM memory has two regions:

a. Heap Memory is the region where our application objects such as Customer, Account, Array List, HashMap… are stored. This region contains Young Generation and Old Generation. Objects in the regions are managed by JVM’s Garbage Collector(GC). The GC automatically manages the heap memory. It reclaims memory occupied by objects that are no longer in use. Accessing heap memory is comparatively slower than native memory, as it involves traversing pointers and managing object references.
b. Native Memory is the region which contains artifacts that are required to execute our program. It’s outside of the heap memory. This region contains Metaspace, Threads, Code Cache, Direct Buffers, Garbage Collector (GC), JNI allocations, and more. But for Metaspace, Native memory is not managed by the JVM’s garbage collector. It’s managed by the operating system and the native code itself. Accessing native memory is faster than accessing heap memory, especially when dealing with direct buffers or data structures optimized for native code.
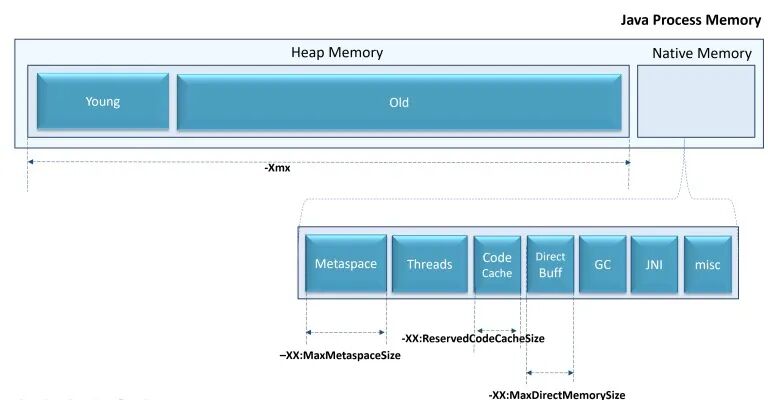
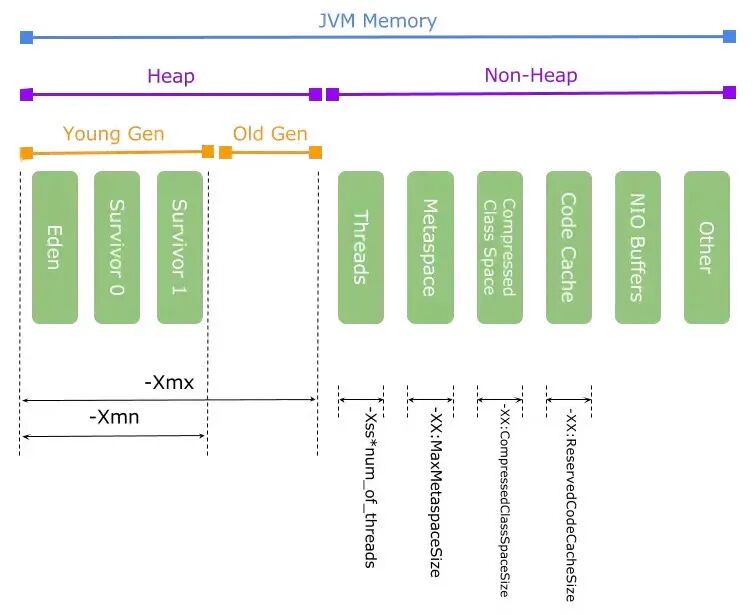
JVM Memory has following internal regions:
1、Heap Memory (Young Generation, Old Generation)
2、Metaspace
3、Threads
4、Code Cache
5、Direct Buffer
6、GC
7、JNI
8、NMT
9、Misc
Java Native Memory has the following internal regions:
1.
Metaspace: Metaspace is the memory region where the JVM stores class metadata, including class names, method definitions, constant pools, annotations, and class-level static variables. Metaspace grows as needed, constrained only by available system memory unless explicitly capped. You can limit its size using the flag -XX:MaxMetaspaceSize= (e.g., -XX:MaxMetaspaceSize=512m). This is especially useful to prevent classloader leaks and excessive native memory usage in large applications. JVM will throw ‘java.lang.OutOfMemoryError: Metaspace’, when metaspace consumption exceeds allocated limit.
2.
Threads: Each Java thread consumes native memory for its call stack and internal structures maintained by the JVM and operating system. The memory allocated per thread includes the stack size, which grows based on the method call depth. You can control the thread stack size using the -Xss flag (e.g., -Xss512k). A high number of threads or excessive stack size may lead to ‘java.lang.OutOfMemoryError: unable to create new native thread’.
3.
Code Cache: JVM doesn’t directly execute the code that we write. It does JIT compilation and optimizes our code for better performance. The Code Cache is where the JVM stores JIT-compiled native code. When the Code Cache fills up, JIT compilation may stop, causing performance degradation. The JVM may even throw an ‘java.lang.OutOfMemoryError: CodeCache is full’. You can control the size of this region using -XX:ReservedCodeCacheSize= (e.g., -XX:ReservedCodeCacheSize=256m).
4.
Direct Buffer: Direct Buffers are memory areas allocated outside the Java heap using the ByteBuffer.allocateDirect() type of APIs. These are commonly used in high-performance IO operations such as NIO and off-heap caching systems. They avoid GC overhead but consume native memory directly. The limit for direct memory allocation can be set using the flag -XX:MaxDirectMemorySize= (e.g., -XX:MaxDirectMemorySize=1g). If this region grows unchecked, it can lead to ‘java.lang.OutOfMemoryError: Direct buffer memory’.
5.
Garbage Collector (GC): In Java Garbage Collection is automatic. For Garbage Collector to run it uses native memory for internal data structures like mark-and-sweep bitmaps, remembered sets, and card tables. These structures help manage the heap efficiently but reside outside the Java heap itself. GC-related native memory isn’t directly tunable with a single flag, but overall memory footprint can be influenced by GC algorithm selection (e.g., G1, ZGC), region size, and heap configuration. Monitoring native memory usage from GC components often requires Native Memory Tracking (NMT).
6.
JNI (Java Native Interface): JNI is used when Java interacts with native libraries (typically C/C++ code). Any memory allocated through native code — malloc, calloc, or native buffers — lives in this region. These allocations are fully outside the JVM’s control and must be explicitly freed by native code. Since JNI allocations bypass the Garbage Collector, leaks here are common if native memory isn’t released properly. There’s no JVM flag to cap JNI memory directly; you must rely on native code hygiene and NMT for diagnostics.
7.
Miscellaneous: The Misc region includes a variety of small but essential allocations that don’t belong to other categories. These include JVM internal data structures, synchronization objects, profiling data, symbols, and error handling support. While typically not the largest contributor to native memory usage, growth in this region can indicate internal JVM pressure or memory fragmentation. This region isn’t configurable with JVM flags, but NMT can help break down memory usage and pinpoint anomalies here.
Reference
Java Native Memory Leaks – Causes, Detection & Fixes[1]
References
[1] Java Native Memory Leaks – Causes, Detection & Fixes: https://blog.gceasy.io/java-native-memory-leaks-causes-detection-fixes/
本文参与 腾讯云自媒体同步曝光计划,分享自微信公众号。
原始发表:2025-10-29,如有侵权请联系 cloudcommunity@tencent.com 删除
目录
腾讯云开发者

Copyright © 2013 - 2026 Tencent Cloud. All Rights Reserved. 腾讯云 版权所有
深圳市腾讯计算机系统有限公司 ICP备案/许可证号:粤B2-20090059  粤公网安备44030502008569号
腾讯云计算(北京)有限责任公司 京ICP证150476号 | 京ICP备11018762号