中文图标可视化,知乎、微博、B站的共同选择

中文图标可视化,知乎、微博、B站的共同选择

wujunmin
发布于 2026-07-06 14:11:52
发布于 2026-07-06 14:11:52
知乎、微博热搜榜,B站后台统计榜的共性是使用了中文图标,Power BI可以表格矩阵可以使用SVG图标实现相同效果。
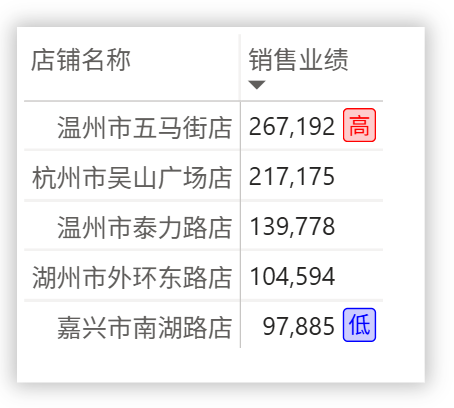
上图文字图标使用了圆角正方形造型,边框、填充色、文字是相同颜色,只是填充色透明度低一些。Power BI新建度量值:
SVG.中文图标 =
SWITCH (
    [M.排名.销售业绩],
    1,
    "data:image/svg+xml;utf8,<svg class='wujunmin' width='48' height='48' xmlns='http://www.w3.org/2000/svg'>
        <rect rx='6' x='1' y='1' width='46' height='46' fill='Red' fill-opacity='0.2' stroke-width='2' stroke='Red'/>
        <text x='24' y='36' font-size='32' text-anchor='middle' fill='Red'>高</text>
    </svg>",
    5,
    "data:image/svg+xml;utf8,<svg class='wujunmin' width='48' height='48' xmlns='http://www.w3.org/2000/svg'>
        <rect rx='6' x='1' y='1' width='46' height='46' fill='Blue' fill-opacity='0.2' stroke-width='2' stroke='Blue'/>
        <text x='24' y='36' font-size='32' text-anchor='middle' fill='Blue'>低</text>
    </svg>"
)
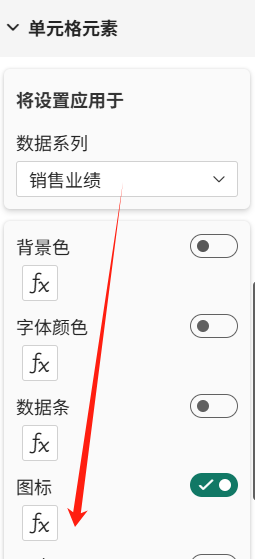
度量值放入表格单元格元素即完工。图标切换逻辑按需修改。
本文参与 腾讯云自媒体同步曝光计划,分享自微信公众号。
原始发表:2026-07-05,如有侵权请联系 cloudcommunity@tencent.com 删除
腾讯云开发者

Copyright © 2013 - 2026 Tencent Cloud. All Rights Reserved. 腾讯云 版权所有
深圳市腾讯计算机系统有限公司 ICP备案/许可证号:粤B2-20090059  粤公网安备44030502008569号
腾讯云计算(北京)有限责任公司 京ICP证150476号 | 京ICP备11018762号