
基于图像熵密度图的PNG/JPG RGB图像叠加
基于图像熵密度图的PNG/JPG RGB图像叠加
提问于 2022-08-16 15:49:15
我有大量的图像,我想要绘制每个图像熵的密度图。我想把个人的图片叠加在密度图上,有没有人对什么是最好的软件包或程序有任何建议?我通常使用Python-3和R,但是如果更容易/更好的话,我会考虑其他的。
回答 1
Stack Overflow用户
发布于 2022-08-19 10:11:12
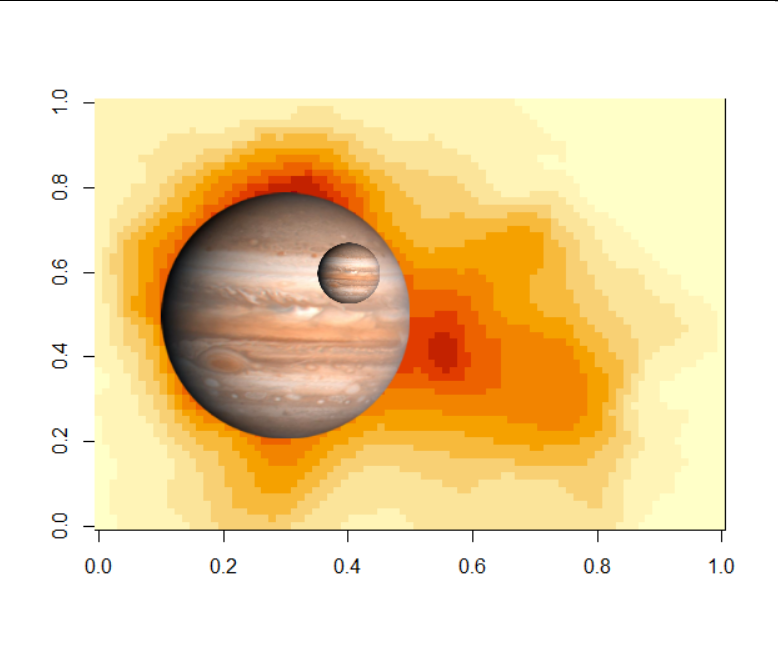
下面是一个使用函数sinkr::addImg()的R选项。通过指定图像中心的x和y坐标以及所需的宽度(以x轴单位表示),可以将图像添加到现有的地块中:
library(sinkr) # https://github.com/marchtaylor/sinkr
library(png)

myurl <- paste0("https://upload.wikimedia.org/wikipedia/commons/thumb/",
  "e/e1/Jupiter_%28transparent%29.png/242px-Jupiter_%28transparent%29.png")
z <- tempfile()
download.file(myurl,z,mode="wb")
pic <- readPNG(z)
file.remove(z) # cleanup
dim(pic)

image(volcano)
addImg(pic, x = 0.3, y = 0.5, width = 0.4)
addImg(pic, x = 0.4, y = 0.6, width = 0.1)
页面原文内容由Stack Overflow提供。腾讯云小微IT领域专用引擎提供翻译支持
原文链接:
https://stackoverflow.com/questions/73376791
复制相关文章
相似问题
腾讯云开发者

Copyright © 2013 - 2026 Tencent Cloud. All Rights Reserved. 腾讯云 版权所有
深圳市腾讯计算机系统有限公司 ICP备案/许可证号:粤B2-20090059 ![]() 粤公网安备44030502008569号
粤公网安备44030502008569号
腾讯云计算(北京)有限责任公司 京ICP证150476号 | 京ICP备11018762号