
调整ggpot2 scale_fill_brewer的灰色值(palette= "Greys")
调整ggpot2 scale_fill_brewer的灰色值(palette= "Greys")
提问于 2021-02-17 10:11:31
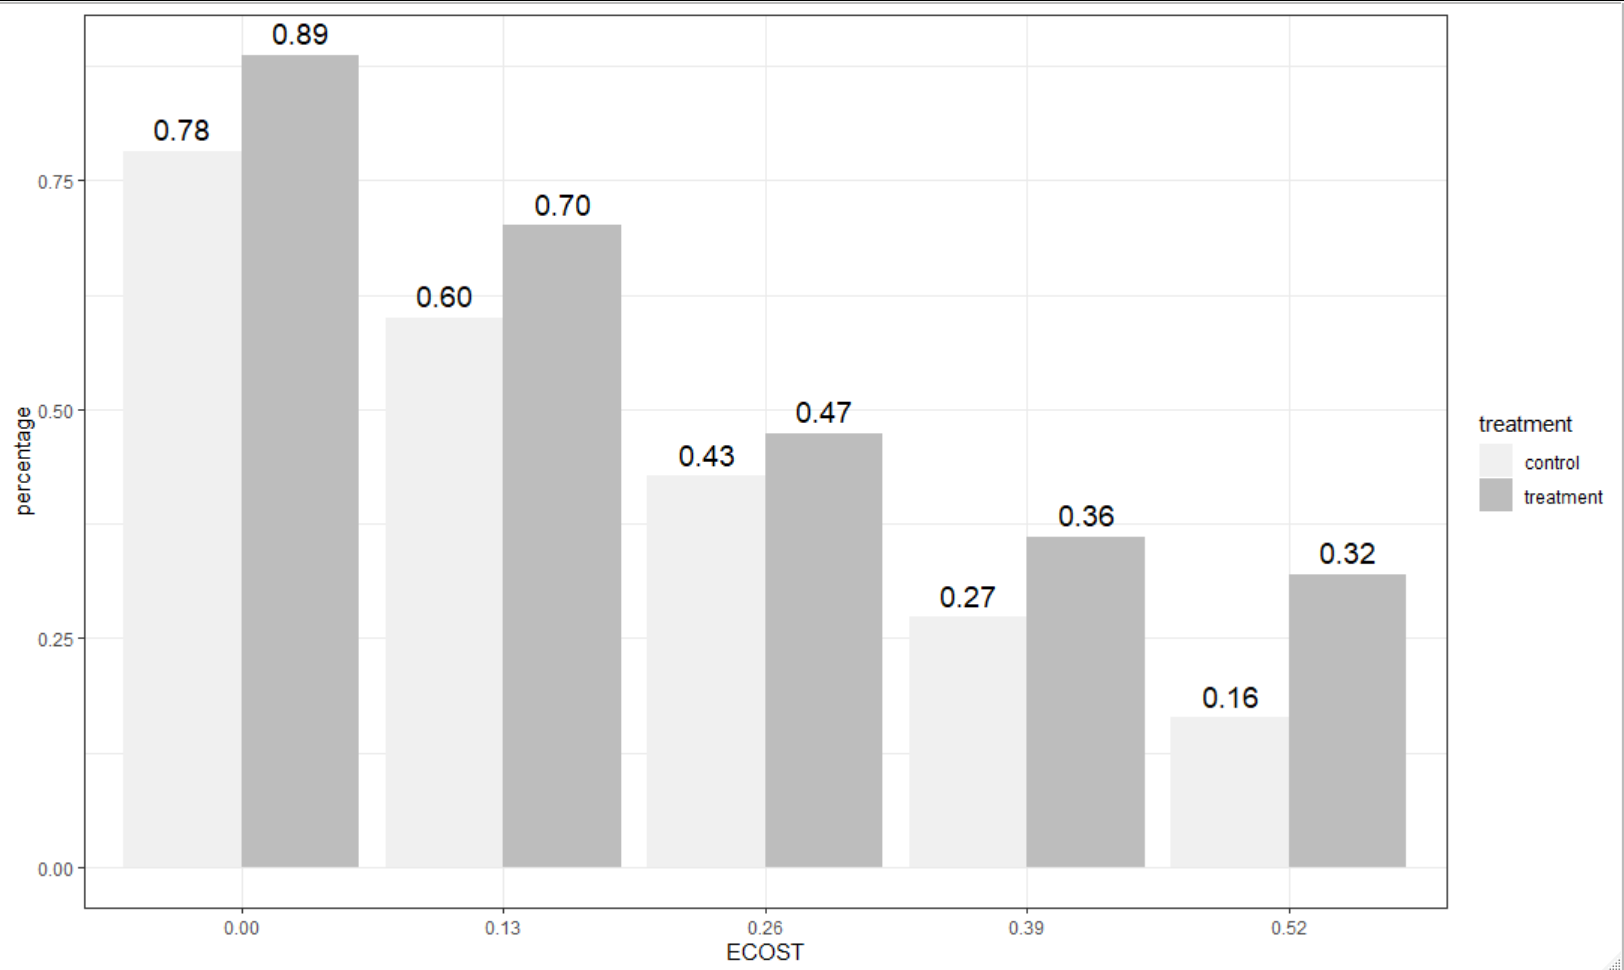
我用下面的数据和代码创建了一个图。我想改变使用的灰色值的酒吧,使他们都一步黑暗。然而,我在?scale_fill_brewer中没有看到任何东西,这将允许我这样做。有什么简单的办法来解决这个问题吗?
数据:
counts_truth  <- structure(list(x_label = c("Truth ECOST = 0.52", "Truth ECOST = 0.39",
"Truth ECOST = 0.26", "Truth ECOST = 0.13", "Truth ECOST = 0.00",
"Truth ECOST = 0.52", "Truth ECOST = 0.39", "Truth ECOST = 0.26",
"Truth ECOST = 0.13", "Truth ECOST = 0.00"), treatment = structure(c(1L,
1L, 1L, 1L, 1L, 2L, 2L, 2L, 2L, 2L), .Label = c("control", "treatment"
), class = "factor", scores = structure(c(control = 0.424793388429752,
treatment = 0.498594189315839), .Dim = 2L, .Dimnames = list(c("control",
"treatment")))), percentage = c(0.163636363636364, 0.272727272727273,
0.427272727272727, 0.6, 0.781818181818182, 0.319587628865979,
0.360824742268041, 0.474226804123711, 0.701030927835051, 0.88659793814433
), remove = c("Truth ECOST ", "Truth ECOST ", "Truth ECOST ",
"Truth ECOST ", "Truth ECOST ", "Truth ECOST ", "Truth ECOST ",
"Truth ECOST ", "Truth ECOST ", "Truth ECOST "), ECOST = c("0.52",
"0.39", "0.26", "0.13", "0.00", "0.52", "0.39", "0.26", "0.13",
"0.00")), row.names = c(NA, -10L), class = c("data.table", "data.frame"
))

library(ggplot2)
counts_truth %>%
ggplot(aes(x = ECOST, y = percentage, fill = treatment, label=sprintf("%0.2f", round(percentage, digits = 2)))) +
geom_col(position = 'dodge') +
geom_text(position = position_dodge(width = .9),    # move to center of bars
          vjust = -0.5,    # nudge above top of bar
          size = 5) +
scale_fill_brewer(palette = "Greys") +
theme_bw()
回答 1
Stack Overflow用户
回答已采纳
发布于 2021-02-17 17:39:08
一个快速的解决方案是使用scale_fill_grey来调整灰色的连续体,使其稍微变暗。根据您的数据集,下面的内容将使情节变暗。
根据需要调整start和end参数。它们介于0(黑色)到1(白色)之间。
counts_truth %>%
    ggplot(aes(x = ECOST, y = percentage, fill = treatment, label=sprintf("%0.2f", round(percentage, digits = 2)))) +
    geom_col(position = 'dodge') +
    geom_text(position = position_dodge(width = .9),    # move to center of bars
              vjust = -0.5,    # nudge above top of bar
              size = 5) +
    scale_fill_grey(start = 0.8, end = 0.5) +
theme_bw()页面原文内容由Stack Overflow提供。腾讯云小微IT领域专用引擎提供翻译支持
原文链接:
https://stackoverflow.com/questions/66239814
复制相关文章
相似问题
腾讯云开发者

Copyright © 2013 - 2026 Tencent Cloud. All Rights Reserved. 腾讯云 版权所有
深圳市腾讯计算机系统有限公司 ICP备案/许可证号:粤B2-20090059 ![]() 粤公网安备44030502008569号
粤公网安备44030502008569号
腾讯云计算(北京)有限责任公司 京ICP证150476号 | 京ICP备11018762号