
使用Matplotlib在直线上选择N个点
使用Matplotlib在直线上选择N个点
提问于 2020-12-15 11:59:01
我试图使用random库随机选择一个跨越一条线的点的样本,但我得到的只是一些奇怪的线条。通过选择每个元组的第一个索引和列表的每个索引,从2- tuple的列表中生成红线。
下面是脚本示例:
path =[(403, 0), (403, 1), (403, 2), (403, 3), (403, 4), (403, 5), (403, 6), (403, 7), (403, 8), (403, 9), (403, 10)]

path_to_plot = [x[0] for x in path]#List only with the rows numbers

#Representation of the matrix
#plt.matshow(path_to_plot)
random_list = random.sample(path_to_plot,N_PLOT_SAMPLES)
random_list_y = random.sample(path_to_plot,N_PLOT_SAMPLES)
print("Random list:\n",random_list)

plt.plot(random_list, random_list_y)
plt.plot(path_to_plot,color='r',label="Path")#Plots the path
plt.show()
生成的地块如下
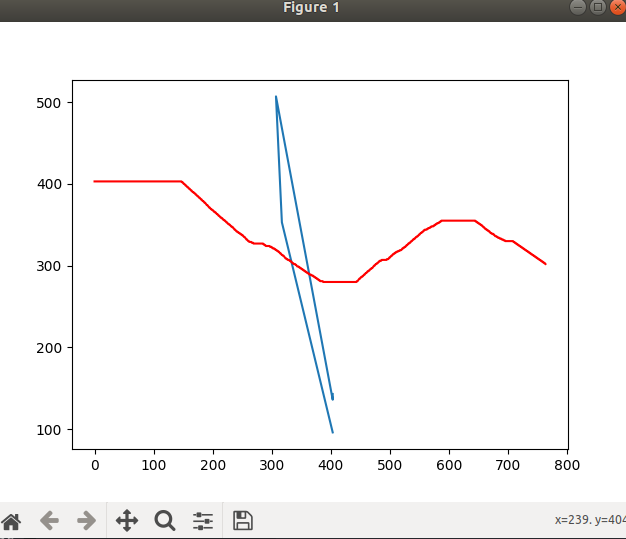
有没有办法在红线上生成N个点?
回答 1
Stack Overflow用户
回答已采纳
发布于 2020-12-15 12:17:55
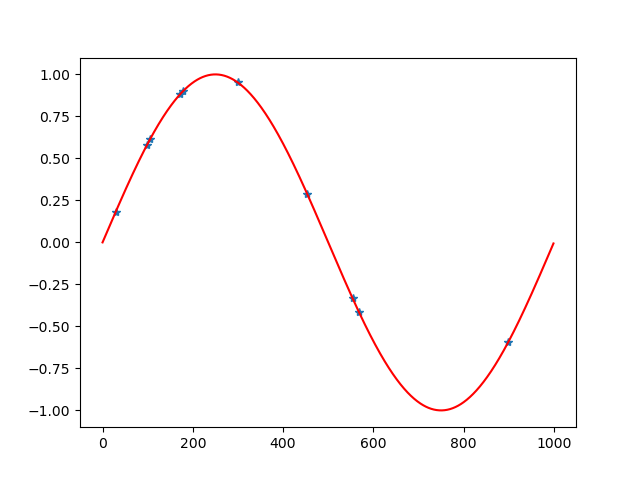
在plt.plot()调用中,您似乎是将来自random.sample()的y值作为x和y输入提供。下面是一个有用的例子:
import random
import numpy as np

N_PLOT_SAMPLES = 10
# create some fake data
path_to_plot = np.sin(2*np.pi*np.arange(1000)/1000)
nsamples = len(path_to_plot)
# random indices
random_list_x = random.sample(range(nsamples), N_PLOT_SAMPLES)
# corresponding y values
random_list_y = path_to_plot[random_list_x]
# plot
plt.plot(random_list_x, random_list_y, '*')
plt.plot(path_to_plot, color='r', label="Path")
plt.show()
输出:
(顺便说一句,将来最好包含一个最小的可重复代码示例。目前人们无法直接运行您的代码,因为您没有提供path。)
页面原文内容由Stack Overflow提供。腾讯云小微IT领域专用引擎提供翻译支持
原文链接:
https://stackoverflow.com/questions/65305419
复制相关文章
相似问题
腾讯云开发者

Copyright © 2013 - 2026 Tencent Cloud. All Rights Reserved. 腾讯云 版权所有
深圳市腾讯计算机系统有限公司 ICP备案/许可证号:粤B2-20090059  粤公网安备44030502008569号
腾讯云计算(北京)有限责任公司 京ICP证150476号 | 京ICP备11018762号