
scipy.signal中模拟贝塞尔模型的设置
scipy.signal中模拟贝塞尔模型的设置
提问于 2020-04-16 12:59:43
我一直在尝试使用scipy.signal实现一个截止频率为2 2kHz的模拟贝塞尔滤波器,并且我对要设置的Wn值感到困惑,因为文档声明Wn (对于模拟滤波器)应该设置为角频率(大约为12000 rad/s )。但是如果我用1秒的虚拟数据来实现这一点,以50万赫兹采样半秒的脉冲,我会得到一串0和nans。我错过了什么?
import numpy as np
import scipy
import matplotlib.pyplot as plt
import scipy.signal

def make_signal(pulse_length, rate = 500000):
    new_x = np.zeros(rate)
    end_signal = 250000+pulse_length
    new_x[250000:end_signal] = 1
    data = new_x
    print (np.shape(data))
    # pad on both sides
    data=np.concatenate((np.zeros(rate),data,np.zeros(rate)))
    return data

def conv_time(t):
    pulse_length = t * 500000
    pulse_length = int(pulse_length)
    return pulse_length

def make_data(ti): #give time in seconds
    pulse_length=conv_time(ti)
    print (pulse_length)
    data = make_signal(pulse_length)
    return data
time_scale = np.linspace(0,1,500000)
data = make_data(0.5)


[b,a] = scipy.signal.bessel(4, 12566.37, btype='low', analog=True, output='ba', norm='phase', fs=None)

output_signal = scipy.signal.filtfilt(b, a, data)
plt.plot(data[600000:800000])

plt.plot(output_signal[600000:800000])

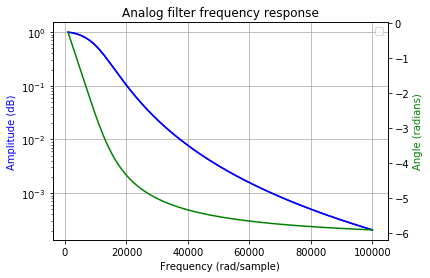
当我用频率来策划反应时,对我来说并没有那么糟糕;我在哪里犯了一个错误?
回答 1
Stack Overflow用户
回答已采纳
发布于 2020-04-16 15:42:32
您正在将一个模拟滤波器传递给一个函数scipy.signal.filtfilt,该函数需要一个数字(即离散时间)滤波器。如果要使用filtfilt或lfilter,则过滤器必须是数字的。
要使用连续时间系统,请查看以下功能
scipy.signal.impulse(scipy.signal.impulse2)scipy.signal.step(scipy.signal.step2)scipy.signal.lsim(scipy.signal.lsim2)
( 2版本解决的数学问题与没有2的版本相同,但使用的方法不同。在大多数情况下,没有2的版本很好,并且比2版本快得多。)
其他相关的函数和类在连续时间线性系统文档的SciPy部分中列出。
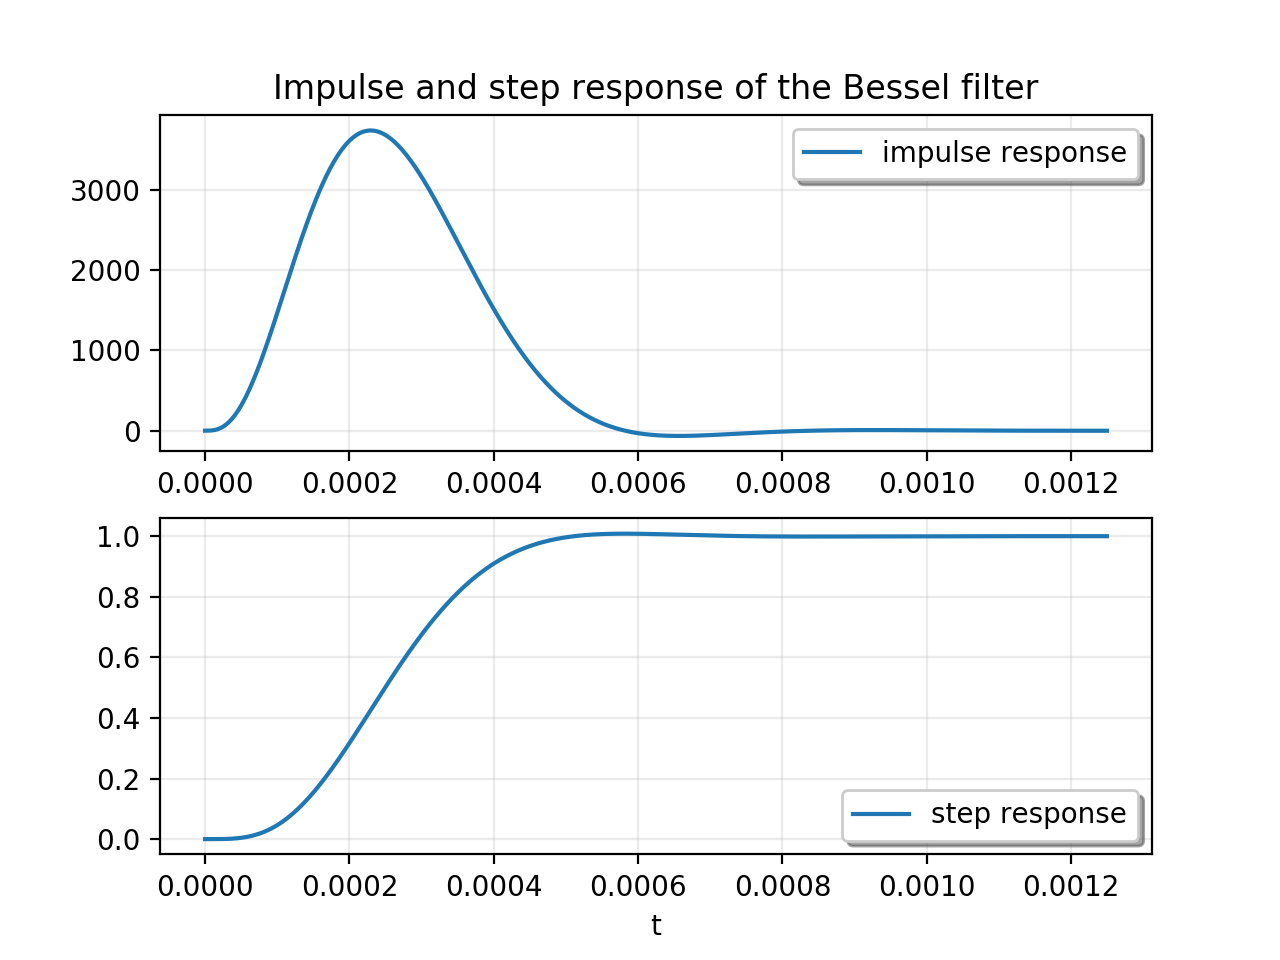
例如,下面的脚本绘制了Bessel过滤器的冲动和步长响应:
import numpy as np
from scipy.signal import bessel, step, impulse
import matplotlib.pyplot as plt


order = 4
Wn = 2*np.pi * 2000
b, a = bessel(order, Wn, btype='low', analog=True, output='ba', norm='phase')

# Note: the upper limit for t was chosen after some experimentation.
# If you don't give a T argument to impulse or step, it will choose a
# a "pretty good" time span.
t = np.linspace(0, 0.00125, 2500, endpoint=False)
timp, yimp = impulse((b, a), T=t)
tstep, ystep = step((b, a), T=t)


plt.subplot(2, 1, 1)
plt.plot(timp, yimp, label='impulse response')
plt.legend(loc='upper right', framealpha=1, shadow=True)
plt.grid(alpha=0.25)
plt.title('Impulse and step response of the Bessel filter')

plt.subplot(2, 1, 2)
plt.plot(tstep, ystep, label='step response')
plt.legend(loc='lower right', framealpha=1, shadow=True)
plt.grid(alpha=0.25)
plt.xlabel('t')
plt.show()
脚本生成这个情节:
页面原文内容由Stack Overflow提供。腾讯云小微IT领域专用引擎提供翻译支持
原文链接:
https://stackoverflow.com/questions/61250845
复制相关文章
相似问题
腾讯云开发者

Copyright © 2013 - 2026 Tencent Cloud. All Rights Reserved. 腾讯云 版权所有
深圳市腾讯计算机系统有限公司 ICP备案/许可证号:粤B2-20090059 ![]() 粤公网安备44030502008569号
粤公网安备44030502008569号
腾讯云计算(北京)有限责任公司 京ICP证150476号 | 京ICP备11018762号