
如何使用ggplot2绘制fda对象?
如何使用ggplot2绘制fda对象?
提问于 2020-09-04 16:52:46
使用fda包,我创建了名为“弧线”的fd对象:
splinebasis = create.bspline.basis(rangeval = c(0,100),
                                     nbasis = 23,
                                     norder = 4)
curve = smooth.basis(x, y, splinebasis)$fd
此时,我可以通过命令轻松地绘制fd对象:
plot(curve)
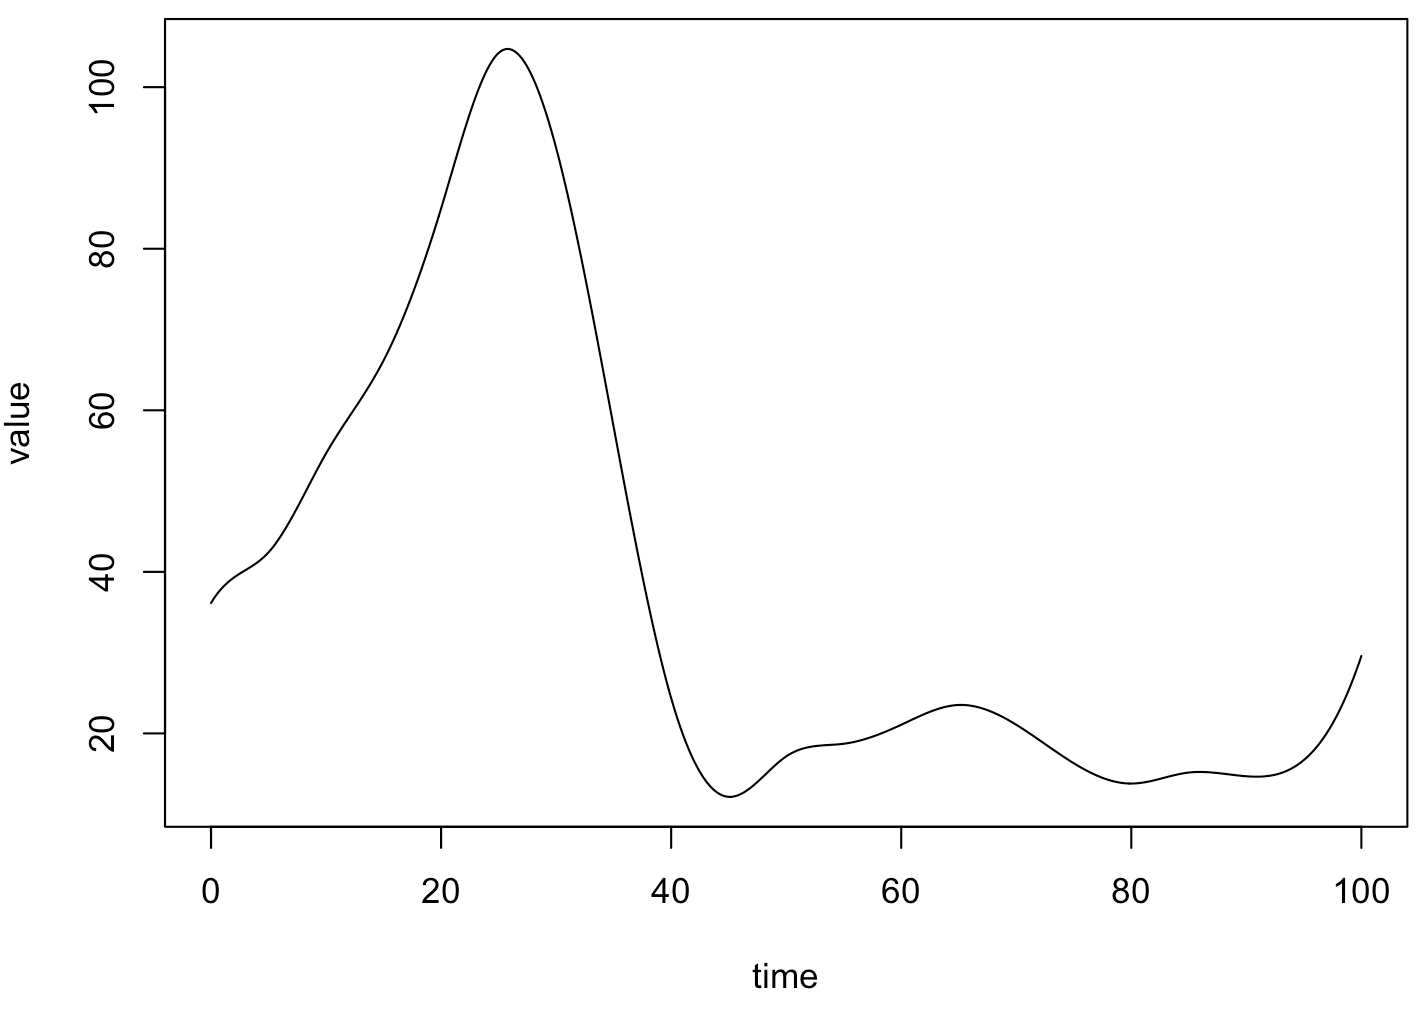
取得很好的结果。
我想做的是用ggplot2包绘制对象,但不幸的是,我不知道如何编码ggplot2 s.t。它用基和系数来返回连续曲线*。
- --我实际上是用eval.fd绘制的,但是我希望用ggplot来绘制实际的B样条函数,而不是一些新生成的离散点。
回答 1
Stack Overflow用户
回答已采纳
发布于 2020-09-04 21:32:05
下面是一个简单的解决方案,使用来自predict包的fda。
library(fda)
set.seed(1)
x <- 0:100
y <- cumsum(rnorm(101))

splinebasis <- create.bspline.basis(rangeval = c(0,100),
                                     nbasis = 23,
                                     norder = 4)
curve <- smooth.basis(x, y, splinebasis)

# Plot using base graphic engine
plot(curve$fd)
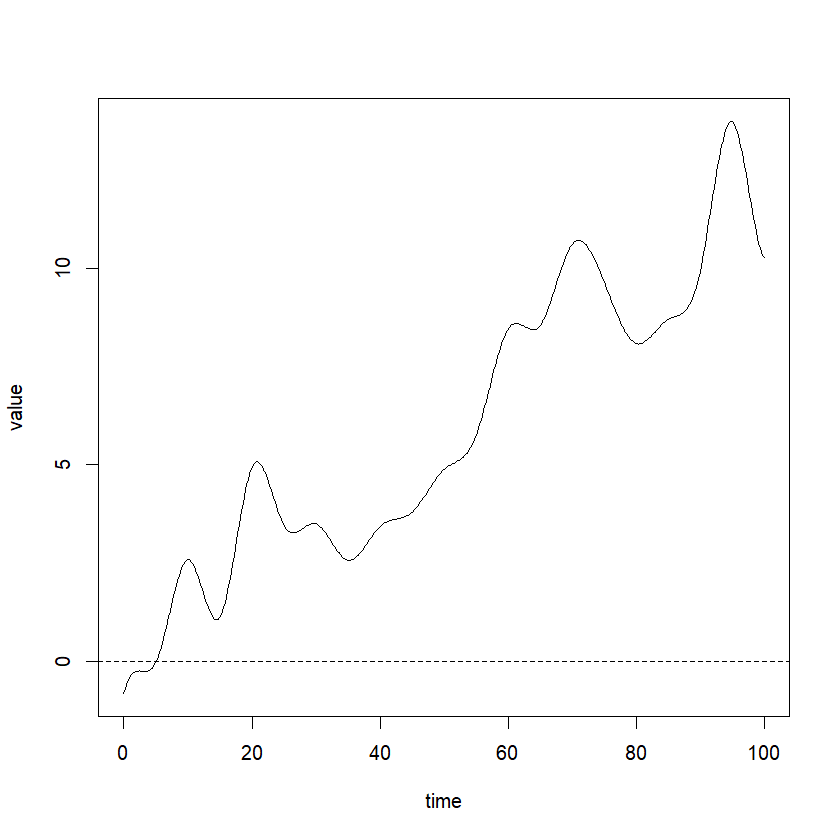
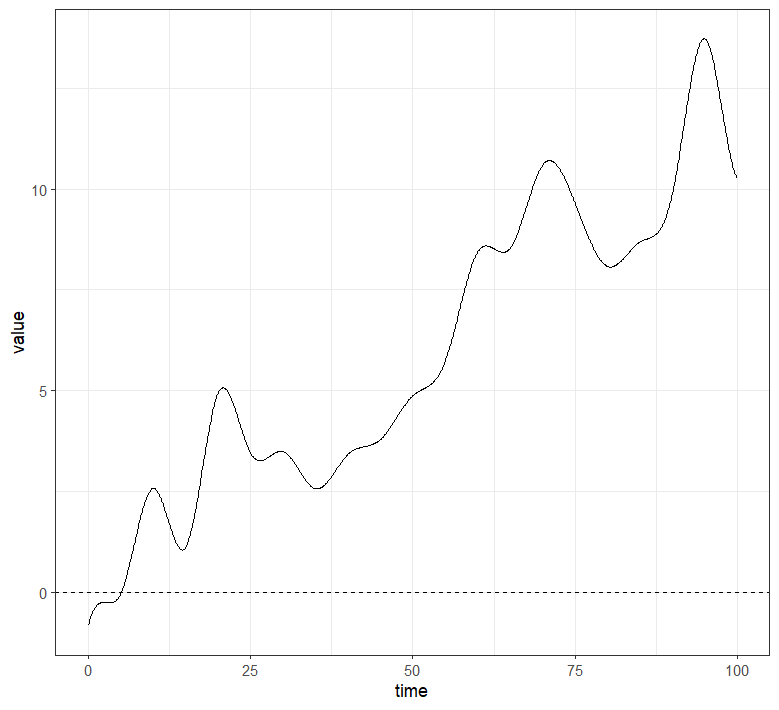
# Plot using ggplot2
library(ggplot2)
xx <- seq(0,100,0.1)
df <- data.frame(x=xx, yhat = predict(curve, newdata=xx))
ggplot(data=df, aes(x=x, y=yhat)) +
  geom_line() +
  geom_hline(aes(yintercept=0), linetype=2) +
  labs(x="time", y="value") +
  theme_bw()
页面原文内容由Stack Overflow提供。腾讯云小微IT领域专用引擎提供翻译支持
原文链接:
https://stackoverflow.com/questions/63745186
复制相关文章
相似问题
腾讯云开发者

Copyright © 2013 - 2026 Tencent Cloud. All Rights Reserved. 腾讯云 版权所有
深圳市腾讯计算机系统有限公司 ICP备案/许可证号:粤B2-20090059 ![]() 粤公网安备44030502008569号
粤公网安备44030502008569号
腾讯云计算(北京)有限责任公司 京ICP证150476号 | 京ICP备11018762号