
如何动态绘制自己计算数据集的AUC
如何动态绘制自己计算数据集的AUC
提问于 2021-04-01 18:48:17
我有两个模型,即2, and 3。我有10 test datasets。对于每个模型和每个数据集,我应用了不同的阈值(每个测试数据集的8个阈值)。我还计算了每个测试数据集的true positive rate, false-positive rate, etc。
我正在使用的代码
auc_graph <- calculation_information[1:10, ] %>%
  ggplot(mapping = aes(x = FPR_All, y = TPR_All, fill = SP_length)) +
geom_line()当我试图绘制AUC时,我发现必须更改cell values manually。就像[1:10, ] or [11: 20,] etc。当然,这不是一个好主意,也不可能,因为(我有更多的模型)。
现在,是否有任何选项将自动更改单元格值conditions,并将自动保存绘图one after another?或者知道我该怎么解决这些问题?
可复制数据集
structure(list(SP_length = c(2L, 2L, 2L, 2L, 2L, 2L, 2L, 2L,
3L, 3L, 3L, 3L, 3L, 3L, 3L, 2L, 2L, 2L, 2L, 2L, 2L, 2L, 2L, 2L,
3L, 3L, 3L, 3L, 3L, 3L, 3L, 2L, 2L, 2L, 2L, 2L, 2L, 2L, 2L, 2L,
2L, 3L, 3L, 3L, 3L, 3L, 3L, 3L, 3L, 3L), Test_dataset = c(1L,
1L, 1L, 1L, 1L, 1L, 1L, 1L, 1L, 1L, 1L, 1L, 1L, 1L, 1L, 2L, 2L,
2L, 2L, 2L, 2L, 2L, 2L, 2L, 2L, 2L, 2L, 2L, 2L, 2L, 2L, 3L, 3L,
3L, 3L, 3L, 3L, 3L, 3L, 3L, 3L, 3L, 3L, 3L, 3L, 3L, 3L, 3L, 3L,
3L), Prediction_Threshold = c(1.01590126290632, 1.11590126290632,
1.21590126290632, 1.31590126290632, 1.41590126290632, 1.51590126290632,
1.61590126290632, 1.71590126290632, 1.73978185992124, 1.83978185992124,
1.93978185992124, 2.03978185992124, 2.13978185992124, 2.23978185992124,
2.33978185992124, 1.01590126290632, 1.11590126290632, 1.21590126290632,
1.31590126290632, 1.41590126290632, 1.51590126290632, 1.61590126290632,
1.71590126290632, 1.81590126290632, 1.80215326487164, 1.90215326487164,
2.00215326487164, 2.10215326487164, 2.20215326487164, 2.30215326487164,
2.40215326487164, 1.01590126290632, 1.11590126290632, 1.21590126290632,
1.31590126290632, 1.41590126290632, 1.51590126290632, 1.61590126290632,
1.71590126290632, 1.81590126290632, 1.91590126290632, 1.73978185992124,
1.83978185992124, 1.93978185992124, 2.03978185992124, 2.13978185992124,
2.23978185992124, 2.33978185992124, 2.43978185992124, 2.53978185992124
), TPR_All = c(1, 1, 0.916372202591284, 0.273262661955241, 0.113074204946996,
0.0577149587750294, 0.0188457008244994, 0.00471142520612485,
1, 0.555555555555556, 0.333333333333333, 0.222222222222222, 0.111111111111111,
0.111111111111111, 0, 1, 1, 0.910377358490566, 0.274764150943396,
0.108490566037736, 0.0577830188679245, 0.0188679245283019, 0.00943396226415094,
0.00117924528301887, 1, 0.444444444444444, 0.333333333333333,
0.111111111111111, 0, 0, 0, 1, 1, 0.895610913404508, 0.230130486358244,
0.107947805456702, 0.0557532621589561, 0.0166073546856465, 0.0118623962040332,
0.00474495848161329, 0.00118623962040332, 1, 0.8, 0.5, 0.5, 0.3,
0.2, 0.2, 0.2, 0.1), FPR_All = c(1, 0.999260901699926, 0.920177383592018,
0.212860310421286, 0.0307957625030796, 0.00394185760039419, 0,
0, 1, 0.871914609739827, 0.244162775183456, 0.0907271514342895,
0.0433622414943296, 0.00733822548365577, 0.00333555703802535,
1, 0.999266503667482, 0.896332518337408, 0.211735941320293, 0.0371638141809291,
0.0039119804400978, 0, 0, 0, 1, 0.42235609103079, 0.171352074966533,
0.0796519410977242, 0.0307898259705489, 0.0100401606425703, 0.00267737617135207,
1, 0.99927728258251, 0.90966032281378, 0.215851602023609, 0.0298723199229101,
0.00433630450493857, 0, 0, 0, 0, 1, 0.880108991825613, 0.335149863760218,
0.0831062670299728, 0.0333787465940054, 0.0143051771117166, 0.00136239782016349,
0, 0)), row.names = c(NA, 50L), class = "data.frame")回答 1
Stack Overflow用户
回答已采纳
发布于 2021-04-01 19:18:36
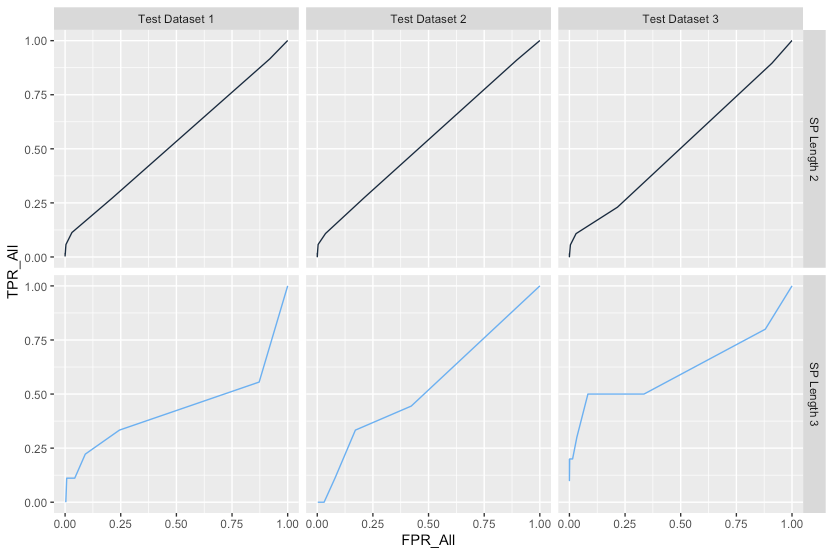
似乎是facet_grid的完美使用
ggplot(calculation_information, mapping = aes(x = FPR_All, y = TPR_All, color = SP_length)) +
  geom_line(show.legend = FALSE) +
  facet_grid(SP_length ~ Test_dataset,
             labeller = labeller(Test_dataset = function(x)paste0("Test Dataset ",x),
                                 SP_length = function(x)paste0("SP Length ",x)))
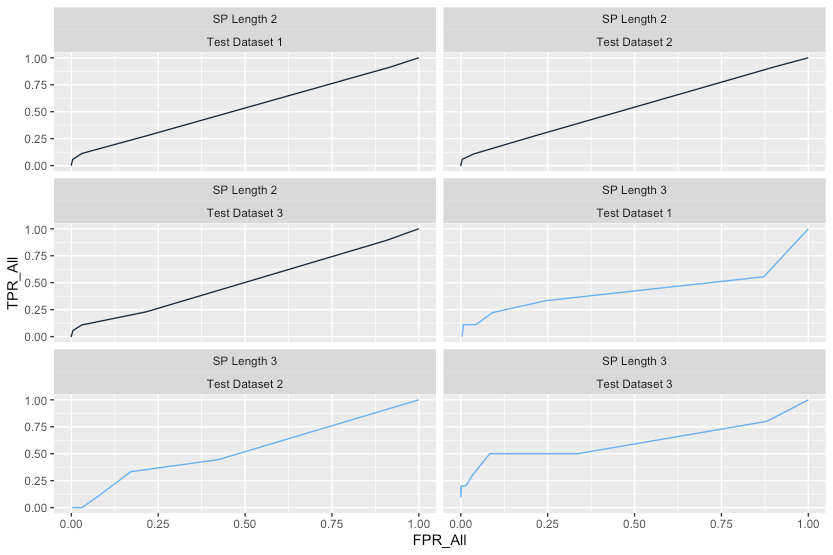
您也可以使用facet_wrap,它提供行数和列数的控制,但是面条更难定位:
ggplot(calculation_information, mapping = aes(x = FPR_All, y = TPR_All, color = SP_length)) +
  geom_line(show.legend = FALSE) +
  facet_wrap(SP_length ~ Test_dataset, ncol = 2,
             labeller = labeller(Test_dataset = function(x)paste0("Test Dataset ",x),
                                 SP_length = function(x)paste0("SP Length ",x)))
页面原文内容由Stack Overflow提供。腾讯云小微IT领域专用引擎提供翻译支持
原文链接:
https://stackoverflow.com/questions/66910013
复制相关文章
相似问题
腾讯云开发者

Copyright © 2013 - 2026 Tencent Cloud. All Rights Reserved. 腾讯云 版权所有
深圳市腾讯计算机系统有限公司 ICP备案/许可证号:粤B2-20090059 ![]() 粤公网安备44030502008569号
粤公网安备44030502008569号
腾讯云计算(北京)有限责任公司 京ICP证150476号 | 京ICP备11018762号