
Python -绘制列表列表与其他列表
Python -绘制列表列表与其他列表
提问于 2014-08-26 14:23:38
所以,我有这样一个站(字符串)的列表:
station_list=[station1, station2, station3, ..., station63]我有一个清单,上面有每个站的测量值,但是它们的数量不一样。所以,我有这样的事情:
measure_list=[[200.0, 200.0, 200.0, 200.0, 200.0, 300.0], [400.0, 400.0, 300.0, 300.0, 300.0, 300.0, 300.0, 300.0, 300.0], [300.0, 400.0, 400.0, 400.0, 400.0], ..., [1000.0, 1000.0, 1000.0, 1000.0, 1000.0], [7000.0]]measure_list有63个“子列表”,每个站都有一个子列表。
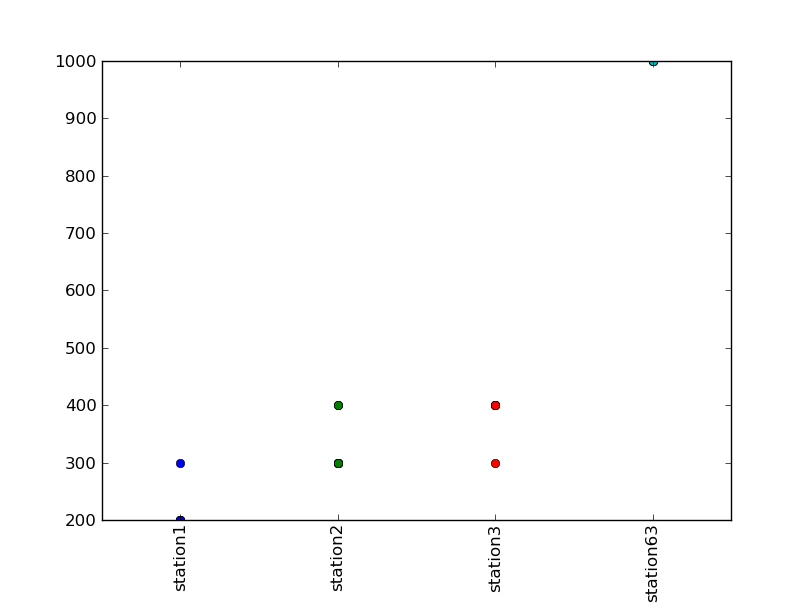
最后,我想用x轴上的站点和y轴上的度量来创建一个图表,以比较这个站点的所有度量。
谢谢你的帮助。(对我糟糕的英语表示歉意;)
回答 1
Stack Overflow用户
回答已采纳
发布于 2014-08-26 14:52:00
我建议遵循这个例子..。
以下是一次改编,其结果是:
import numpy as np
import matplotlib.pyplot as plt

station_list=['station1', 'station2', 'station3', 'station63']
measure_list=[
    [200.0, 200.0, 200.0, 200.0, 200.0, 300.0],
    [400.0, 400.0, 300.0, 300.0, 300.0, 300.0, 300.0, 300.0, 300.0],
    [300.0, 400.0, 400.0, 400.0, 400.0],
    [1000.0, 1000.0, 1000.0, 1000.0, 1000.0],
    ]
x = range(len(station_list))

assert len(station_list) == len(measure_list) == len(x)

for i, label in enumerate(station_list):
    y_list = measure_list[i]
    x_list = (x[i],) * len(y_list)

    plt.plot(x_list, y_list, 'o')

# You can specify a rotation for the tick labels in degrees or with keywords.
plt.xticks(x, station_list, rotation='vertical')

# Pad margins so that markers don't get clipped by the axes
# plt.margins(0.2)
plt.xlim(np.min(x) - 0.5, np.max(x) + 0.5)

# Tweak spacing to prevent clipping of tick-labels
plt.subplots_adjust(bottom=0.15)
plt.show()
这意味着:
页面原文内容由Stack Overflow提供。腾讯云小微IT领域专用引擎提供翻译支持
原文链接:
https://stackoverflow.com/questions/25508249
复制相关文章
相似问题
腾讯云开发者

Copyright © 2013 - 2026 Tencent Cloud. All Rights Reserved. 腾讯云 版权所有
深圳市腾讯计算机系统有限公司 ICP备案/许可证号:粤B2-20090059  粤公网安备44030502008569号
腾讯云计算(北京)有限责任公司 京ICP证150476号 | 京ICP备11018762号