
在一个大型pdf文件的每一页上放置多幅图
在一个大型pdf文件的每一页上放置多幅图
提问于 2018-10-29 13:54:30
我正在尝试打印几十个ggplot绘图到一个pdf文件。我想要每页四块的pdf。我如何使用for循环来创建情节并以我想要的格式结束?
names_vec <- colnames(raw_data)

pdf(file = 'test1.pdf')
for(i in names_vec) {
  print(ggplot(raw_data, aes(x = Group, y = raw_data[[i]])) +
    geom_boxplot(na.rm = TRUE) +
    labs(title = i, y = 'Relative Intensity') +
    theme(axis.text.x = element_text(size = 8, angle = 45)))
}

dev.off()
这就是我到目前为止所做的。par不适合我。类似地,grid.arrange似乎与循环策略不兼容。
示例代码如下:
Group     glycine serine alanine threonine
 1 Gatorade       NA     NA      NA        NA
 2 Gatorade       NA     NA      NA        NA
 3 Gatorade       NA     NA      NA        NA
 4 Lime        17950 203400 2512000    864500
 5 Lime        17950 193400 2621000    828500
 6 Lime        18270 203200 2381000    885200
 7 Lime        19370 214400 2623000    869000
 8 Lime        17860 221200 2629000    786600
 9 Lime        17570 196000 2667000    868900
10 Michelob    11820 388900 1563000    339100
11 Michelob    10670 419300 1460000    351100
12 Michelob    10240 363800 1601000    333800
13 Michelob    10550 390000 1498000    358000
14 Michelob     9073 391700 1575000    368500
15 Michelob     9507 363700 1358000    358200
16 Porch       15840 303200 3604000    229700
17 Porch       16390 290800 3769000    253900
18 Porch       15340 271900 3476000    222900
19 Porch       17590 284800 3707000    232200
20 Porch       17080 340200 3925000    262200
21 Porch       13380 265900 3595000    223000
22 26-2 Beer   17620 117100 3732000    159900
23 26-2 Beer   16350 136500 3509000    148500
24 26-2 Beer   16460 116100 3364000    143100
25 26-2 Beer   17510 131500 3440000    147500
26 26-2 Beer   15360 116700 3442000    134900
27 26-2 Beer   15770 117400 3539000    144100
28 Marathon    17150 215300 2848000    190200
29 Marathon    17480 146400 3018000    176600
30 Marathon    15450 160200 3003000    205500
31 Marathon    15070 154200 2808000    185300
32 Marathon    15610 158200 2790000    199800
33 Marathon    16610 157700 2788000    205500

names_vec <- c('glycine', 'serine', 'alanine', 'threonine')
p <- list()
for(i in names_vec) {
  p[[i]] <- ggplot(raw_data, aes(x = Group, y = raw_data[[i]])) +
          geom_boxplot(na.rm = TRUE) +
          labs(title = i, y = 'Relative Intensity') +
          theme(axis.text.x = element_text(size = 8, angle = 45))
}

pdf(file = 'test1.pdf')
multiplot(p[[1]], p[[2]], p[[3]], p[[4]], cols = 2)
dev.off()
不幸的是,这会产生一个页面,它有四个相同的情节--保存标题,这是正确的。
回答 1
Stack Overflow用户
回答已采纳
发布于 2018-10-29 14:13:57
编辑答复。这就是你想要的吗?如果没有,请进一步解释。
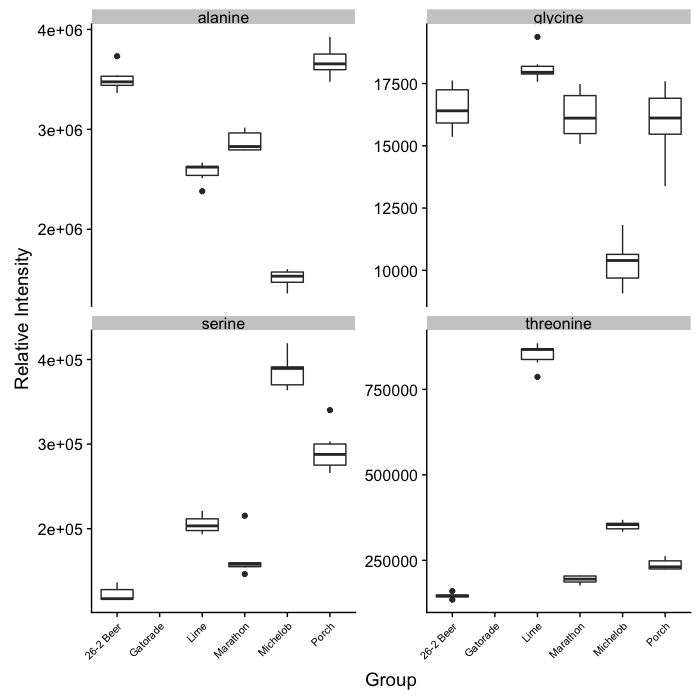
在这种情况下,以正确的格式提供数据要比摆弄ggplot容易得多。一旦数据采用长格式而不是宽格式,就不再需要for循环了。此代码生成以下图形:
library(tidyverse)
raw_data = read_delim("stackoverflowdata.csv", col_names = TRUE, delim = ";") %>%
  gather(compound, value, -Group)

ggplot(raw_data,aes(x=Group, y =value)) +
  geom_boxplot(na.rm = TRUE) +
  facet_wrap(vars(compound), scales="free_y") +
  labs(y = 'Relative Intensity') +
  theme(axis.text.x = element_text(size = 8, angle = 45, hjust = 1 ))
页面原文内容由Stack Overflow提供。腾讯云小微IT领域专用引擎提供翻译支持
原文链接:
https://stackoverflow.com/questions/53047033
复制相关文章
相似问题
腾讯云开发者

Copyright © 2013 - 2026 Tencent Cloud. All Rights Reserved. 腾讯云 版权所有
深圳市腾讯计算机系统有限公司 ICP备案/许可证号:粤B2-20090059  粤公网安备44030502008569号
腾讯云计算(北京)有限责任公司 京ICP证150476号 | 京ICP备11018762号