
Z值矩阵的三维直方图
Z值矩阵的三维直方图
提问于 2018-12-03 08:48:47
我在论坛上搜索过,但我只找到了相似但不同的答案和问题。我在绘制从z值矩阵开始的三维直方图时遇到了问题。
这是我从以前的操作中得到的矩阵:
[[  84.           80.76923077   68.05555556   56.57894737   60.
    44.7761194    55.2238806    39.0625       27.41935484   29.8245614 ]
 [  82.44274809   67.70833333   63.75         44.44444444   47.76119403
    33.33333333   22.78481013   19.23076923    9.21052632    2.63157895]
 [  53.33333333   61.76470588   48.64864865   34.61538462    0.
    16.66666667   0.            0.            0.            0.        ]
 [  48.           25.            0.            0.            0.
    0.            0.             0.            0.            0. ]]
这些都是z值。X和y值只是它们沿矩阵的位置。我刚刚查看了matplotlib页面,但是所有的例子都是从x,y-值开始的。我也在论坛上看过,但这个问题略有不同。
我试着做这样的事情:
hist, xedges, yedges = np.histogram2d(x, y, bins=(20,20))
xpos, ypos = np.meshgrid(xedges[:-1]+xedges[1:], yedges[:-1]+yedges[1:])
dx = xedges [1] - xedges [0]
dy = yedges [1] - yedges [0]
dz = hist.flatten()

ax.bar3d(xpos, ypos, zpos, dx, dy, dz, zsort='average')
但我很难理解如何输入x,y值。有人能帮我吗?
更新:
len_x, len_y = matrix.shape
x = np.linspace(0,len_x-1,len_x)
y = np.linspace(0,len_y-1,len_y)


# 3D PLOT:

fig = plt.figure()
ax = fig.add_subplot(111, projection='3d')


hist, xedges, yedges = np.histogram2d(x,y)
xpos, ypos = np.meshgrid(xedges[:-1]+xedges[1:], yedges[:-1]+yedges[1:])

xpos = xpos.flatten()/2.
ypos = ypos.flatten()/2.
zpos = np.zeros_like(xpos)

dx = xedges [1] - xedges [0]
dy = yedges [1] - yedges [0]
dz = hist.flatten()

max_height = np.max(dz)
min_height = np.min(dz)

ax.bar3d(xpos, ypos, zpos, dx, dy, dz, zsort='average')回答 1
Stack Overflow用户
回答已采纳
发布于 2018-12-03 12:43:56
不知道你想要什么。尝试以下代码作为起点:
import numpy  as np
import matplotlib.pyplot as plt
from mpl_toolkits.mplot3d import Axes3D

matrix = np.array([
    [84., 80.76923077, 68.05555556, 56.57894737, 60.,
     44.7761194, 55.2238806, 39.0625, 27.41935484, 29.8245614],
    [82.44274809, 67.70833333, 63.75, 44.44444444, 47.76119403,
     33.33333333, 22.78481013, 19.23076923, 9.21052632, 2.63157895],
    [53.33333333, 61.76470588, 48.64864865, 34.61538462, 0.,
     16.66666667, 0., 0., 0., 0.],
    [48., 25., 0., 0., 0., 0., 0., 0., 0., 0. ]])

fig = plt.figure()
ax = fig.add_subplot(111, projection='3d')

xpos = [range(matrix.shape[0])]
ypos = [range(matrix.shape[1])]
xpos, ypos = np.meshgrid(xpos, ypos)
xpos = xpos.flatten('F')
ypos = ypos.flatten('F')
zpos = np.zeros_like(xpos)

dx = 0.5 * np.ones_like(zpos)
dy = dx.copy()
dz = matrix.flatten()

ax.bar3d(xpos, ypos, zpos, dx, dy, dz, color='b', zsort='average')

plt.show()
结果是:
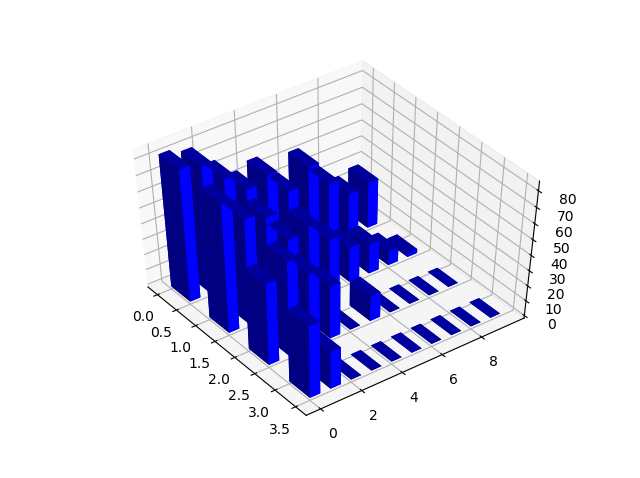
该代码是对这个例子的matplotlib.org修改。
页面原文内容由Stack Overflow提供。腾讯云小微IT领域专用引擎提供翻译支持
原文链接:
https://stackoverflow.com/questions/53590227
复制相关文章
相似问题
腾讯云开发者

Copyright © 2013 - 2026 Tencent Cloud. All Rights Reserved. 腾讯云 版权所有
深圳市腾讯计算机系统有限公司 ICP备案/许可证号:粤B2-20090059  粤公网安备44030502008569号
腾讯云计算(北京)有限责任公司 京ICP证150476号 | 京ICP备11018762号