代码实战 | 这一次来画画区别于上一篇的动力对流层顶

代码实战 | 这一次来画画区别于上一篇的动力对流层顶

用户11172986
发布于 2026-07-01 20:29:20
发布于 2026-07-01 20:29:20
代码实战 | 这一次来画画区别于上一篇的动力对流层顶
前言
嗯,在上一期的对流层顶教程发布之后呢,有读者询问,对于对流层顶有什么作用
当然,上期定义的对流层底,一般是气候方面的研究使用的定义。而天气方面的定义则是用2 PVU作为对流层顶的定义,也就是所谓的动力对流层顶
本 notebook 基于 ERA5 等压面(pl)数据,使用 MetPy 提取任意起止点之间的垂直剖面,
绘制温度剖面(cross-section),并使用 MetPy 内置的potential_vorticity_baroclinic
计算 Ertel 斜压位涡(PV),再以 2 PVU 等值面确定动力对流层顶,
将其作为一条线叠加在温度剖面上。
对流层顶定义对比
定义 | 方法 | 物理基础 |
|---|---|---|
WMO 热力对流层顶 | 递减率 < 2 K/km | 温度垂直梯度 |
2 PVU 动力对流层顶 | PV = 2 PVU | 位涡(热力 + 动力) |
- 1 PVU = 10⁻⁶ K·m²·kg⁻¹·s⁻¹
- 2 PVU 面是平流层与对流层之间的动力学边界
- 数据:
ERA5-2023-08_pl.nc(37 层等压面,1–1000 hPa) - 剖面方法:
metpy.interpolate.cross_section - PV 计算:
metpy.calc.potential_vorticity_baroclinic(含斜压项)
导入必要的库
import xarray as xr
import numpy as np
import matplotlib.pyplot as plt
from metpy.interpolate import cross_section
import metpy.calc as mpcalc
from metpy.units import units

import warnings
warnings.filterwarnings('ignore')
数据读取与位涡(PV)计算
使用 metpy.calc.potential_vorticity_baroclinic 一步完成计算,
内部自动处理位温、涡度、科里奥利参数及斜压项。
注意:气压必须按升序排列(1→1000 hPa),ERA5 level 坐标天然满足。 计算在完整 3D 网格
(level, lat, lon)上进行,再提取剖面。
# ── 加载 ERA5 数据 ──
file_path = '/home/mw/input/era58091/ERA5-2023-08_pl.nc'
ds = xr.open_dataset(file_path)
ds_cf = ds.isel(time=0).metpy.parse_cf()

# ── 提取变量 ──
t   = ds_cf['t']        # 温度 (K), dims: (level, lat, lon)
u   = ds_cf['u']        # 纬向风 (m/s)
v   = ds_cf['v']        # 经向风 (m/s)

# ── 获取气压坐标并广播到 3D ──
p_1d = t.metpy.vertical                       # 1D, 带单位
p_3d = (p_1d * units.hPa).broadcast_like(t)   # 广播到 (level, lat, lon)

# ── 计算位温 θ = T * (p0/p)^κ ──
theta = mpcalc.potential_temperature(p_3d, t)

# ── 计算斜压位涡(MetPy 内置)──
pv = mpcalc.potential_vorticity_baroclinic(theta, p_3d, u, v)

# ── 转换为 PVU (1 PVU = 10⁻⁶ K·m²·kg⁻¹·s⁻¹) ──
pv_pvu = (pv * 1e6).metpy.dequantify()
pv_pvu.attrs['units'] = 'PVU'
pv_pvu.attrs['long_name'] = 'Baroclinic Potential Vorticity (MetPy)'

# ── 将 PV 添加到数据集 ──
ds_cf['pv'] = pv_pvu

print(f'数据维度: {t.shape} (level, lat, lon)')
print(f'气压范围: {float(p_1d.min())}–{float(p_1d.max())} hPa')
print(f'PV 范围: {float(pv_pvu.min()):.2f} ~ {float(pv_pvu.max()):.2f} PVU')
数据维度: (37, 241, 361) (level, lat, lon)
气压范围: 1.0–1000.0 hPa
PV 范围: -5459.91 ~ 7834.25 PVU
剖面提取
使用 MetPy 的 cross_section 函数提取沿路径的温度和位涡剖面。
由于 PV 已在 3D 网格上计算完毕,cross_section 会自动对 PV 进行插值。
# 定义剖面起点和终点(纬度, 经度)
start_point = (45, 100.0)   # (lat, lon)
end_point   = (20, 130.0)   # (lat, lon)

# 提取剖面(包含温度 t 和位涡 pv)
cross = cross_section(ds_cf, start_point, end_point)
print(cross)
<xarray.Dataset> Size: 239kB
Dimensions:    (level: 37, index: 100)
Coordinates:
  * level      (level) int32 148B 1 2 3 5 7 10 20 ... 875 900 925 950 975 1000
    time       datetime64[ns] 8B 2023-08-02
    metpy_crs  object 8B Projection: latitude_longitude
    longitude  (index) float64 800B 100.0 100.4 100.8 ... 129.5 129.8 130.0
    latitude   (index) float64 800B 45.0 44.79 44.59 44.38 ... 20.56 20.28 20.0
  * index      (index) int64 800B 0 1 2 3 4 5 6 7 8 ... 92 93 94 95 96 97 98 99
Data variables:
    z          (level, index) float64 30kB 4.752e+05 4.751e+05 ... 445.0 507.9
    r          (level, index) float64 30kB -0.0005729 -0.0005729 ... 87.7 89.32
    t          (level, index) float64 30kB 259.9 259.9 260.1 ... 299.6 299.3
    q          (level, index) float64 30kB 4.049e-06 4.049e-06 ... 0.01905 0.019
    u          (level, index) float64 30kB -39.16 -38.9 -38.8 ... 8.306 7.847
    v          (level, index) float64 30kB 2.141 2.308 2.252 ... 13.12 13.05
    w          (level, index) float64 30kB -0.00102 -0.001254 ... 0.01719
    pv         (level, index) float64 30kB 3.984e+03 3.784e+03 ... -0.01588
Attributes:
    Conventions:  CF-1.6
    history:      2024-01-09 16:38:26 GMT by grib_to_netcdf-2.25.1: /opt/ecmw...
确定 2 PVU 动力对流层顶
对于剖面上每个水平点,沿垂直方向(从平流层到对流层)寻找 PV 首次穿越 2 PVU 的气压值。
- 气压升序排列(1 → 1000 hPa),即从高空向地面搜索
- 平流层 PV > 2 PVU,对流层 PV < 2 PVU
- 在对数气压坐标下线性插值,提高精度
# 获取剖面数据
cross_pv = cross['pv'].values     # (level, index)
cross_p  = cross['level'].values  # 升序: 1 → 1000 hPa

# ── 向量化寻找 2 PVU 穿越点 ──
# 布尔掩码:逐层判断 PV 是否从 ≥2 降至 <2(平流层→对流层)
crossing = (cross_pv[:-1] >= 2) & (cross_pv[1:] < 2)

# 每列首个穿越层索引 + 对数气压线性插值
k = np.argmax(crossing, 0)                                   # 首个穿越层
r = np.arange(len(k))                                        # 列索引辅助
trop_pressure_2pvu = np.where(
    crossing.any(0),
    np.exp(np.log(cross_p[k])
           + (2 - cross_pv[k, r]) / (cross_pv[k + 1, r] - cross_pv[k, r])
           * np.log(cross_p[k + 1] / cross_p[k])),
    np.nan)

print(f'2 PVU 对流层顶气压范围: {np.nanmin(trop_pressure_2pvu):.1f} ~ {np.nanmax(trop_pressure_2pvu):.1f} hPa')
print(f'有效点数: {crossing.any(0).sum()} / {len(trop_pressure_2pvu)}')
2 PVU 对流层顶气压范围: 83.1 ~ 331.7 hPa
有效点数: 100 / 100
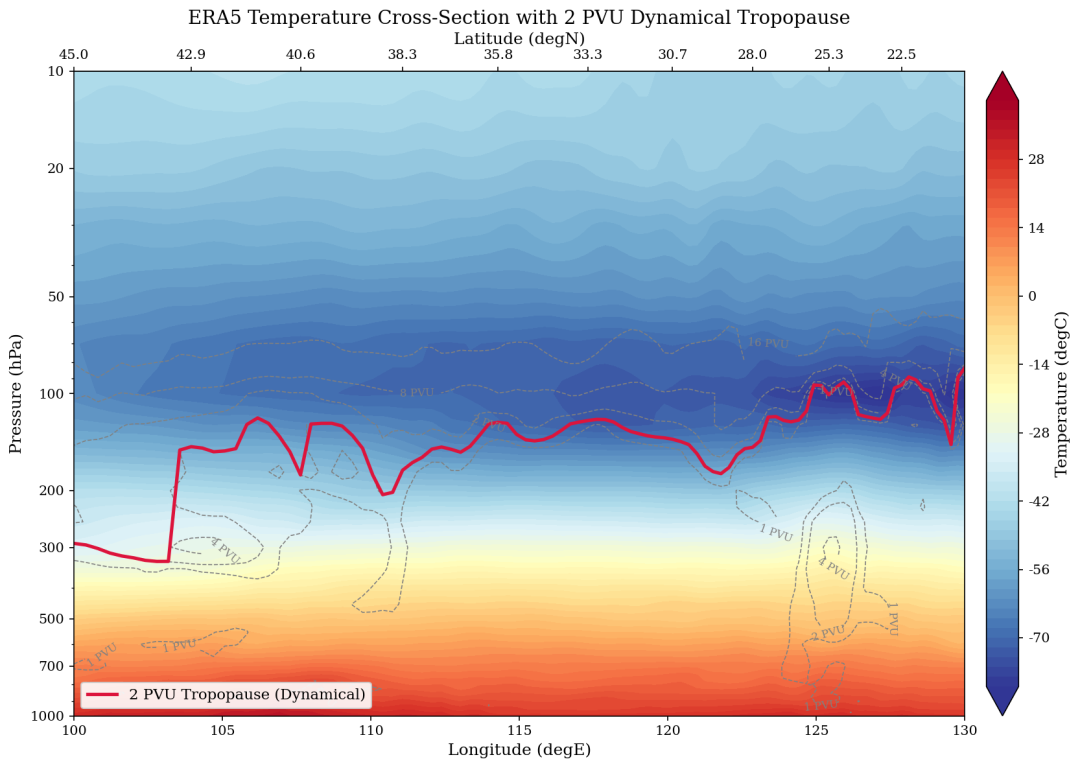
绘图:温度剖面 + 2 PVU 对流层顶线
以经度为横轴、气压(对数坐标)为纵轴,绘制温度填色剖面, 叠加 PV 等值线(灰色虚线)和 2 PVU 对流层顶(红色实线)。 同时在顶部副轴标注纬度,便于对照。
plt.rcParams['font.family'] = 'serif'
plt.rcParams['font.serif'] = ['DejaVu Serif', 'Times New Roman']
plt.rcParams['axes.unicode_minus'] = False

fig, ax = plt.subplots(figsize=(12, 8), dpi=150)

lon = cross['longitude'].values
lat = cross['latitude'].values
lev = cross['level'].values
temp_c = cross['t'].values - 273.15
pv_cross = cross['pv'].values

# ── 温度填色 ──
cf = ax.contourf(lon, lev, temp_c, levels=np.arange(-80, 41, 2),
                  cmap='RdYlBu_r', extend='both')
cbar = fig.colorbar(cf, ax=ax, pad=0.02)
cbar.set_label('Temperature (degC)', fontsize=12)

# ── PV 等值线(灰色虚线)──
pv_levels = [1, 2, 4, 8, 16]
cs = ax.contour(lon, lev, pv_cross, levels=pv_levels,
                colors='gray', linewidths=0.8, linestyles='--')
ax.clabel(cs, inline=True, fontsize=8, fmt='%d PVU')

# ── 2 PVU 对流层顶(红色实线)──
ax.plot(lon, trop_pressure_2pvu, color='crimson', lw=2.5, ls='-',
        label='2 PVU Tropopause (Dynamical)')

ax.legend(loc='lower left', fontsize=11, framealpha=0.9)

# ── 坐标轴设置 ──
ax.set_yscale('log')
ax.set_ylim(1000, 10)
ax.set_yticks([1000, 700, 500, 300, 200, 100, 50, 20, 10])
ax.set_yticklabels(['1000', '700', '500', '300', '200', '100', '50', '20', '10'])

ax.set_xlabel('Longitude (degE)', fontsize=12)
ax.set_ylabel('Pressure (hPa)', fontsize=12)
ax.set_title('ERA5 Temperature Cross-Section with 2 PVU Dynamical Tropopause',
             fontsize=14)

# ── 顶部副轴:纬度标签 ──
ax2 = ax.secondary_xaxis('top')
ax2.set_xticks(lon[::10])
ax2.set_xticklabels([f'{v:.1f}'for v in lat[::10]])
ax2.set_xlabel('Latitude (degN)', fontsize=12)

plt.tight_layout()
plt.savefig('temperature_cross_section_2pvu.png', dpi=200, bbox_inches='tight')
plt.show()

print('图像已保存: temperature_cross_section_2pvu.png')
output
output
图像已保存: temperature_cross_section_2pvu.png
总结
本 notebook 实现了基于 2 PVU 位涡 的动力对流层顶计算与可视化:
- 位涡计算:使用
metpy.calc.potential_vorticity_baroclinic在完整 3D 网格上计算 Ertel 斜压位涡 - 剖面提取:使用 MetPy
cross_section同时插值温度和 PV - 对流层顶确定:在对数气压坐标下线性插值寻找 PV = 2 PVU 的穿越点
与 WMO 热力对流层顶的对比
特征 | WMO 热力对流层顶 | 2 PVU 动力对流层顶 |
|---|---|---|
物理基础 | 温度递减率 | 位涡(热力+动力) |
计算方法 | 递减率 < 2 K/km | PV = 2 PVU |
适用区域 | 全球 | 中高纬度效果最佳 |
物理意义 | 热力稳定度突变 | 动力-热力耦合边界 |
典型气压 | ~100–200 hPa(热带更高) | ~200–300 hPa(中纬度) |
嗯,可以看出这个和上一期的热力对流层顶区别很大,并且看起来不是很平滑
等有空了写成函数合并到开源库去
本文参与 腾讯云自媒体同步曝光计划,分享自微信公众号。
原始发表:2026-06-30,如有侵权请联系 cloudcommunity@tencent.com 删除
评论
登录后参与评论
推荐阅读
目录
腾讯云开发者

Copyright © 2013 - 2026 Tencent Cloud. All Rights Reserved. 腾讯云 版权所有
深圳市腾讯计算机系统有限公司 ICP备案/许可证号:粤B2-20090059 ![]() 粤公网安备44030502008569号
粤公网安备44030502008569号
腾讯云计算(北京)有限责任公司 京ICP证150476号 | 京ICP备11018762号